Introduction
Immigrants continue to contribute significantly to Manitoba’s economy, labour market, and social fabric. Immigration has gained in importance given the increase in labour shortages witnessed as economies emerged from the COVID-19 pandemic.
Data in this report was created by the Province of Manitoba using Immigration, Refugees and Citizenship Canada (IRCC) Q4 2021 immigration data (for permanent and temporary residents), and has been approved by IRCC for public release. Please note that all values between 0 and 5 are shown as “– –”. This is done to prevent individuals from being identified when IRCC data is compiled and compared to other publicly available statistics. All other values are rounded to the closest multiple of 5 for the same reason. Data may not sum to the totals indicated because rounded figures were used. Data are preliminary and subject to change.
1. Immigration Trends
Manitoba’s population continues to grow through the arrival of all categories of immigrants. Over 164,000 permanent residents declared Manitoba as their intended destination in Canada from 2011 to 2021. By Q4 2021 Manitoba was estimated to have 1.4 million people, accounting for about 3.6 percent of Canada’s total population of 38.4 million.[1] In 2021, 16,560 immigrants who chose Manitoba as their immigration destination became permanent residents, representing 4.1 percent of total immigration to Canada. This marks an increase of 7,930 permanent resident admissions from pandemic affected 2020 (91.9% annual growth), facilitated by an easing of COVID-19 border restrictions.
The Manitoba Provincial Nominee Program (MPNP) continues to be the main tool for bringing skilled immigrants to meet Manitoba’s labour and economic development needs. The MPNP nominates skilled workers, international student graduates, and business investors who are best suited to contribute to Manitoba’s economy.
From 2012 to 2021, provincial nominee admissions represented two-thirds of all immigrants who declared Manitoba as their intended destination, and approximately 91% of all economic immigrants to the province. In 2021, Manitoba’s provincial nominees accounted for 80.5 percent of all economic immigrants (10,315) while 19.5% of economic immigrants (2,500) arrived under federal streams. This marks a reduction in the MPNP’s share of economic immigrants from 2020 (89.7%) and is mainly attributable to two factors:
- Significant growth in permanent resident admissions through the Canadian Experience Class program of the Government of Canada’s Express Entry system for skilled workers; and
- The federal temporary public policy in effect from May 6 – November 5, 2021 that allowed a host of temporary residents in Canada to apply for permanent residence through six different streams targeting workers in healthcare; essential, non-healthcare occupations; recent international graduates from a Canadian institution; and French-speaking candidates falling under each category (the Temporary Resident to Permanent Resident Pathway).
In addition to the Temporary Resident to Permanent Resident (TR to PR) Pathway, 2021 immigrant admissions data saw landings of candidates through the Rural and Northern Immigration Pilot (RNIP) in Manitoba for the first time. Immigrant admissions through both pathways are captured under the ‘Other Economic’ category in Tables 1 and 2 below. There were 50 immigrants who landed in Manitoba through RNIP in 2021, accounting for 9 percent of the national total (555). A further 1,080 were admitted as permanent residents to our province through the TR to PR Pathway that year, accounting for the over 600 percent increase of Other Economic immigrants to Manitoba from 2020 to 2021 (rising from 370 in 2020 to 2,350 in 2021). Permanent residents declaring Manitoba as their intended destination through the TR to PR Pathway accounted for 4.5 percent of all immigrants who landed in Canada via the temporary public policy in 2021 (23,880).
Immigration pathways that fall under ‘Other Economic’ in Table 1 are as follows:
- Canadian Experience Class
- Caregivers
- RNIP
- Federal Skilled Trades
- Federal business immigrants (entrepreneurs, investors, self-employed businesspeople, and those launching start-up businesses)
- TR to PR Pathway
In addition to the foregoing, the Other [Federal] Economic category in Tables 2 and 3 at the Canada-wide level includes immigrants admitted through the Atlantic Immigration Program (AIP) and the federal Agri-Food Immigration Pilot. The AIP saw its first immigrants admitted to permanent residence in 2017 (rising from 80 that year to 4,920 in 2021). The Agri-Food Immigration Pilot saw its first admissions in 2021 (185 throughout Canada, 0 in Manitoba).
Table 1: Manitoba (Province of Intended Destination) - Admissions of Permanent Residents by Immigration Category, 2011–2021
| Immigration Category | 2011 | 2012 | 2013 | 2014 | 2015 | 2016 | 2017 | 2018 | 2019 | 2020 | 2021 | Total |
|---|---|---|---|---|---|---|---|---|---|---|---|---|
| Sponsored Family | 1,490 | 1,800 | 2,000 | 1,845 | 1,850 | 2,375 | 2,475 | 2,745 | 3,160 | 1,495 | 2,330 | 23,565 |
| Federal Skilled Workers | 620 | 660 | 620 | 390 | 715 | 490 | 295 | 540 | 620 | 295 | 145 | 5,385 |
| Provincial Nominees | 12,355 | 9,540 | 8,865 | 12,195 | 10,260 | 9,960 | 9,430 | 9,895 | 12,545 | 5,835 | 10,315 | 111,195 |
| Other Economic | 190 | 140 | 130 | 270 | 270 | 240 | 335 | 440 | 485 | 370 | 2,350 | 5,220 |
| Resettled Refugees & Protected Persons in Canada | 1,305 | 1,140 | 1,460 | 1,495 | 1,770 | 3,730 | 2,130 | 1,565 | 2,045 | 605 | 1,235 | 18,480 |
| Other | 20 | 45 | 50 | 30 | 35 | 25 | 35 | 50 | 50 | 35 | 180 | 550 |
| Total | 15,975 | 13,330 | 13,120 | 16,235 | 14,900 | 16,820 | 14,705 | 15,225 | 18,910 | 8,630 | 16,560 | 164,410 |
In 2021, Canada welcomed 405,330 new permanent residents, which constitutes an increase of 119.6% from 2020. By immigration category, the largest groups of permanent residents who settled in Canada in 2021 were other economic immigrants (34.4%), Sponsored Family Class (20.0%), refugees (14.8%), provincial nominees (13.3%), and federal skilled workers (8.2%).
Steady growth in global vaccine availability and reductions in COVID-19 travel restrictions seem to have contributed to the significant rebound in immigrant admissions to Canada from 2020 to 2021.
Table 2: Canada - Admissions of Permanent Residents by Immigration Category, 2011–2021
| Immigration Category | 2011 | 2012 | 2013 | 2014 | 2015 | 2016 | 2017 | 2018 | 2019 | 2020 | 2021 | Total |
|---|---|---|---|---|---|---|---|---|---|---|---|---|
| Sponsored Family | 61,335 | 69,870 | 83,375 | 67,645 | 65,490 | 78,000 | 82,470 | 85,170 | 91,310 | 49,295 | 80,995 | 814,950 |
| Federal Skilled Workers | 88,760 | 91,415 | 83,225 | 67,575 | 70,135 | 65,610 | 47,415 | 71,235 | 77,855 | 35,810 | 33,350 | 732,380 |
| Provincial Nominees | 38,420 | 40,890 | 39,905 | 47,625 | 44,535 | 46,180 | 49,730 | 62,440 | 68,645 | 38,720 | 53,970 | 531,055 |
| Other Economic | 28,910 | 28,450 | 25,130 | 49,995 | 55,755 | 44,245 | 62,140 | 52,690 | 50,150 | 31,865 | 165,650 | 594,980 |
| Resettled Refugees & Protected Persons in Canada | 27,880 | 23,090 | 24,005 | 23,460 | 31,615 | 58,550 | 41,120 | 45,495 | 48,530 | 25,490 | 60,155 | 409,390 |
| Other | 3,400 | 4,065 | 3,400 | 4,005 | 4,315 | 3,790 | 3,630 | 4,025 | 4,680 | 3,410 | 11,210 | 49,935 |
| Total | 248,705 | 257,780 | 259,040 | 260,305 | 271,840 | 296,370 | 286,510 | 321,055 | 341,175 | 184,585 | 405,330 | 3,132,700 |
2. Immigration Levels
Canada’s mix of permanent resident admissions changed drastically from 2020 to 2021 as border restrictions eased, allowing immigration candidates overseas to land with permanent resident status. As a result, other economic immigrants increased from 17.3 percent to 40.9 percent of landings – mainly driven by substantial growth in Canadian Experience Class and TR to PR Pathway categories – while refugee admissions ticked upwards from 13.8 to 14.8 percent of the total. The Sponsored Family Class saw its share of landings decline from 26.7 percent to 20 percent from 2020 to 2021. Similar reductions were seen in provincial nominee admissions (21% to 13.3%) and Federal Skilled Workers (19.4% to 8.2%). All other immigration categories saw a strong recovery in admissions from 2020 to 2021. Other Immigration categories saw a more than threefold increase facilitated almost entirely by growth in permanent residence granted through Humanitarian & Compassionate (H&C) cases. Increased landings through H&C appear to stem from significant increases in landings of immigrants with citizenship in Nigeria, Haiti, the People’s Republic (PR) of China, Hong Kong SAR, and the United States of America.
Table 3: Canada - Admissions of Permanent Residents by Immigration Category, 2019–2021
| Immigration Category | 2019 | 2020 | 2021 | |||
|---|---|---|---|---|---|---|
| Number | Percentage | Number | Percentage | Number | Percentage | |
| Sponsored Family | 91,310 | 26.8% | 49,295 | 26.7% | 80,995 | 20.0% |
| Skilled Workers | 77,855 | 22.8% | 35,810 | 19.4% | 33,350 | 8.2% |
| Other Federal Economic | 50,155 | 14.7% | 31,860 | 17.3% | 165,650 | 40.9% |
| Provincial Nominee** | 68,645 | 20.1% | 38,720 | 21.0% | 53,970 | 13.3% |
| Resettled Refugees & Protected Persons in Canada | 48,530 | 14.2% | 25,490 | 13.8% | 60,155 | 14.8% |
| Other* | 4,680 | 1.4% | 3,410 | 1.8% | 11,210 | 2.8% |
| Total | 341,175 | 100.0% | 184,585 | 100.0% | 405,330 | 100.0% |
| Difference from previous year | 20,120 | 6.3% | -156,590 | -45.9% | 220,745 | 119.6% |
*Includes Humanitarian and Compassionate cases, Public Policy cases, and Other immigrants not included elsewhere (permit holders applying for permanent residence).
**Provincial Nominees are a subcategory of the Economic Class.
Immigration by Province or Territory
In 2021, the top destinations for new permanent residents were Ontario, British Columbia, Quebec, Alberta, and Manitoba. All provinces/territories experienced a notable increase in the absolute number of permanent resident admissions from 2020 to 2021. The proportion of admissions relative to total immigration to Canada increased in Ontario, British Columbia, Nova Scotia, and Yukon. It decreased in all other provinces/territories. Despite a near doubling of permanent resident admissions with Manitoba as an intended destination from 2020 to 2021, our province’s share of total immigration to Canada decreased to 4.1 percent in 2021 from 4.7 percent a year earlier. This coincides with the proportional decline in permanent resident admissions through the Provincial Nominee Program seen from 2020 to 2021.
Ontario welcomed just under half of all immigrants to Canada, increasing its share from 44.9 to 48.9 percent from 2020 to 2021. Alberta’s share of Canadian immigration slipped to under 10 percent in 2021 from 12.8 and 12.4 percent in 2019 and 2020, respectively. It is unclear what accounts for the notable upturn in immigrants who did not declare their intended destination in Canada in 2021.
Table 4: Canada - Admissions of Permanent Residents by Province/Territory of Intended Destination, 2019–2021
| Province/Territory | 2019 | 2020 | 2021 | |||
|---|---|---|---|---|---|---|
| Number | Percentage | Number | Percentage | Number | Percentage | |
| Newfoundland and Labrador | 1,850 | 0.5% | 905 | 0.5% | 2,060 | 0.5% |
| Prince Edward Island | 2,445 | 0.7% | 1,290 | 0.7% | 2,630 | 0.6% |
| Nova Scotia | 7,580 | 2.2% | 3,510 | 1.9% | 9,020 | 2.2% |
| New Brunswick | 6,000 | 1.8% | 2,895 | 1.6% | 5,315 | 1.3% |
| Quebec | 40,565 | 11.9% | 25,225 | 13.7% | 50,170 | 12.4% |
| Ontario | 153,395 | 45.0% | 82,965 | 44.9% | 198,085 | 48.9% |
| Manitoba | 18,910 | 5.5% | 8,630 | 4.7% | 16,560 | 4.1% |
| Saskatchewan | 15,855 | 4.6% | 7,400 | 4.0% | 10,935 | 2.7% |
| Alberta | 43,690 | 12.8% | 22,955 | 12.4% | 39,950 | 9.9% |
| British Columbia | 50,230 | 14.7% | 28,490 | 15.4% | 69,270 | 17.1% |
| Yukon | 400 | 0.1% | 175 | – – | 595 | 0.1% |
| Northwest Territories | 195 | – – | 125 | – – | 295 | – – |
| Nunavut | 40 | – – | 20 | – – | 40 | – – |
| Not stated | 15 | – – | – – | – – | 410 | 0.1% |
| Total | 341,175 | 100.0% | 184,585 | 100.0% | 405,330 | 100.0% |
Manitoba saw a year-on-year decrease in the proportion of provincial nominee admissions compared to the previous year (62.3% in 2021 versus 67.6% in 2020). Provincial nominees remain Manitoba’s most important source of immigrants. The slight decline in the provincial nominee share of Manitoba’s overall immigration admissions is due to the significant upturn in Other Federal Economic Class landings (Canadian Experience Class and TR to PR Pathway). Permanent resident admissions to Manitoba through the Sponsored Family Class declined from 17.3 percent to 14.1 percent of all landings, while admissions through the Federal Skilled Workers program witnessed a year-over-year reduction from 3.4 percent to 0.9 percent of landings from 2020 to 2021. Also consistent with the Canada-wide trend, Manitoba witnessed a notable upturn in H&C landings, from 0.4 percent in 2020 to 1.1 percent of admissions in 2021.
Table 5: Manitoba (Province of Intended Destination) - Admissions of Permanent Residents by Immigration Category, 2019–2021
| Immigration Category | 2019 | 2020 | 2021 | |||
|---|---|---|---|---|---|---|
| Number | Percentage | Number | Percentage | Number | Percentage | |
| Sponsored Family | 3,160 | 16.7% | 1,495 | 17.3% | 2,330 | 14.1% |
| Federal Skilled Workers | 620 | 3.3% | 295 | 3.4% | 145 | 0.9% |
| Other Federal Economic Class* | 490 | 2.6% | 365 | 4.2% | 2,355 | 14.2% |
| Provincial Nominee** | 12,545 | 66.3% | 5,835 | 67.6% | 10,315 | 62.3% |
| Resettled Refugees & Protected Persons in Canada | 2,045 | 10.8% | 605 | 7.0% | 1,235 | 7.5% |
| Other*** | 50 | 0.3% | 35 | 0.4% | 180 | 1.1% |
| Total PR landings and percentage of Canada's total immigration | 18,910 | 5.5% | 8,630 | 4.7% | 16,560 | 4.1% |
| Difference from previous year | 3,685 | 24.2% | -10,280 | -54.4% | 7,930 | 91.9% |
*Includes permanent residents who landed in Manitoba through the Canadian Experience Class, Live-in Caregivers, RNIP, Federal Skilled Trades, Federal business immigration streams, and the TR to PR Pathway.
**Provincial nominees are nominated for permanent residence by the Manitoba Provincial Nominee Program (MPNP) and are a category of Economic Class immigrants.
***Includes permanent residents admitted to Manitoba through federal Humanitarian & Compassionate case streams, and all other permit holder classes not covered by the table.
Immigration by City
Winnipeg ranked seventh among Canadian cities as a destination for immigrants in 2021, following Toronto, Vancouver, Montreal, Calgary, Edmonton, and Ottawa. This marks the second year in a row that Winnipeg ranked below Ottawa as an intended destination for immigrants. The gap between immigrant landings in Ottawa and Winnipeg is rising. Permanent residents destined for Ottawa grew from 10,935 in 2019 to 13,705 in 2021. Hamilton, Ontario rejoined the Top Ten list in 2021, overtaking Saskatoon and usual Top Ten member, Regina. Hamilton last appeared in the Top Ten in 2015.
Together, Canada’s Top Ten Census Metropolitan Areas (CMAs) attracted just over 77 percent of new permanent residents to Canada in 2021. This is down slightly from 2019, when the Top Ten CMAs accounted for nearly 80 percent of all immigrant landings. Conversely, immigrant landings outside the Top Ten CMAs grew from just over 20 percent to nearly 23 percent of all landings during the three-year period in question.
The growth of the AIP into a permanent immigration program, along with the recent emergence of RNIP and the federal Agri-Food Immigration Pilot, likely contributed to the increase in Canadian immigrant landings outside the country’s Top Ten CMAs from 2019 to 2021. There were 5,660 immigrants admitted as permanent residents to Canada through the AIP, RNIP, and Agri-Food Immigration Pilot in 2021, accounting for 1.4 percent of all immigrants to Canada.
Despite the upturn in regional immigration, the Toronto CMA continues to be a centre of gravity for Canadian immigration, serving as the intended destination of over one-third of all new immigrants to Canada from 2019–2021. Most of Canada’s largest CMAs witnessed declines in their share of Canadian immigration since 2019, with Toronto and Vancouver being notable exceptions.
Table 6: Canada - Admissions of Permanent Resident by Top Ten (Total 2019–2021 Rank) Census Metropolitan Area (CMA) of Intended Destination, 2019–2021
| Census Metropolitan Area | 2019 | 2020 | 2021 | ||||||
|---|---|---|---|---|---|---|---|---|---|
| Number | Percentage | Rank | Number | Percentage | Rank | Number | Percentage | Rank | |
| Toronto | 117,770 | 34.5% | 1 | 61,050 | 33.1% | 1 | 141,875 | 35.0% | 1 |
| Vancouver | 39,950 | 11.7% | 2 | 22,735 | 12.3% | 2 | 53,730 | 13.3% | 2 |
| Montréal | 34,630 | 10.2% | 3 | 20,975 | 11.4% | 3 | 40,285 | 9.9% | 3 |
| Calgary | 19,625 | 5.8% | 4 | 10,655 | 5.8% | 4 | 17,690 | 4.4% | 4 |
| Edmonton | 16,420 | 4.8% | 5 | 8,355 | 4.5% | 5 | 14,715 | 3.6% | 5 |
| Ottawa - Gatineau (Ontario Part) | 10,935 | 3.2% | 7 | 6,815 | 3.7% | 6 | 13,705 | 3.4% | 6 |
| Winnipeg | 14,740 | 4.3% | 6 | 6,455 | 3.5% | 7 | 12,895 | 3.2% | 7 |
| Halifax | 6,240 | 1.8% | 8 | 2,805 | 1.5% | 10 | 6,895 | 1.7% | 8 |
| Hamilton | — | — | — | — | — | — | 6,610 | 1.6% | 9 |
| Saskatoon | 5,865 | 1.7% | 10 | 2,810 | 1.5% | 9 | 4,285 | 1.1% | 10 |
| Regina | 6,140 | 1.8% | 9 | 2,960 | 1.6% | 8 | — | — | — |
| Total Top Ten | 272,315 | 79.8% | 145,615 | 78.9% | 312,685 | 77.1% | |||
| Rest of Canada | 68,860 | 20.2% | 38,970 | 21.1% | 92,645 | 22.9% | |||
| Total | 341,175 | 100.0% | 184,585 | 100.0% | 405,330 | 100.0% | |||
3. Manitoba Permanent Residents
Sponsored Family
Eligible Canadian citizens and permanent residents living in Canada can sponsor their family members – spouses, dependents, grandparents, and extended family members – to come to Canada. There were 2,330 permanent residents (14.1% of all admissions) who declared Manitoba their intended destination through the Sponsored Family category in 2021; a 55.9 percent increase from the 1,495 who landed in COVID-impacted 2020. Despite the notable increase in overall landings through the Sponsored Family Class, the share of candidates admitted to Manitoba through federal family pathways declined from 17.3 percent to 14.1 percent of total landings from 2020 to 2021. Provincial nominee principal applicants (33.8%) and their spouses and dependents (28.5%) continued to account for approximately two-thirds of all permanent resident landings in Manitoba in 2021. The federal TR to PR Pathway amounted to 6.5 percent of all permanent resident admissions to our province in 2021. The vast majority of these candidates (935 of the 985) were principal applicants 29 years of age or younger. The TR to PR Pathway was overwhelmingly utilized by a young, single demographic.
Table 7: Manitoba (Province of Intended Destination) - Admissions of Permanent Residents by Immigration Category, 2019–2021
| Immigration Category | 2019 | 2020 | 2021 | |||
|---|---|---|---|---|---|---|
| Sponsored Family | Number | Percentage | Number | Percentage | Number | Percentage |
| Principal Applicant (PA) | 2,610 | 13.8% | 1,225 | 14.2% | 1,915 | 11.6% |
| Spouse/Partner/Dependent (SD) | 555 | 2.9% | 270 | 3.1% | 420 | 2.5% |
| Sponsored Family Subtotal | 3,160 | 16.7% | 1,495 | 17.3% | 2,330 | 14.1% |
| Economic Class | ||||||
| Business | 20 | 0.1% | 15 | 0.2% | 20 | 0.1% |
| Canadian Experience Class - PA | 280 | 1.5% | 235 | 2.7% | 900 | 5.4% |
| Canadian Experience Class - SD | 135 | 0.7% | 110 | 1.3% | 285 | 1.7% |
| Caregiver Class - PA | 20 | 0.1% | – – | – – | 10 | – – |
| Caregiver Class - SD | 30 | 0.2% | – – | – – | 5 | – – |
| Provincial Nominees - PA | 5,890 | 31.1% | 2,870 | 33.3% | 5,600 | 33.8% |
| Provincial Nominees - SD | 6,650 | 35.2% | 2,965 | 34.4% | 4,715 | 28.5% |
| Skilled Trades | – – | – – | 5 | – – | – – | – – |
| Skilled Workers - PA | 285 | 1.5% | 170 | 2.0% | 75 | 0.5% |
| Skilled Workers - SD | 335 | 1.8% | 125 | 1.4% | 70 | 0.4% |
| Rural and Northern Immigration Pilot - PA | N/A | N/A | N/A | N/A | 15 | – – |
| Rural and Northern Immigration Pilot - SD | N/A | N/A | N/A | N/A | 35 | 0.2% |
| Temporary Resident to Permanent Resident Pathway - PA | N/A | N/A | N/A | N/A | 985 | 5.9% |
| Temporary Resident to Permanent Resident Pathway - SD | N/A | N/A | N/A | N/A | 95 | 0.6% |
| Economic Class Subtotal | 13,650 | 72.2% | 6,500 | 75.3% | 12,815 | 77.4% |
| Resettled Refugees & Protected Persons in Canada | ||||||
| Government-Assisted Refugees | 550 | 2.9% | 165 | 1.9% | 395 | 2.4% |
| Privately Sponsored Refugees | 1,105 | 5.8% | 190 | 2.2% | 450 | 2.7% |
| Blended Sponsorship Refugees | 155 | 0.8% | – – | – – | 10 | – – |
| Protected Persons in Canada & Dependants | 235 | 1.2% | 250 | 2.9% | 385 | 2.3% |
| Resettled Refugees & Protected Persons in Canada Subtotal | 2,045 | 10.8% | 605 | 7.0% | 1,235 | 7.5% |
| Other | 50 | 0.3% | 35 | 0.4% | 180 | 1.1% |
| Total | 18,910 | 100.0% | 8,630 | 100.0% | 16,560 | 100.0% |
Refugees
In 2021, refugees from all over the world settled in communities throughout Manitoba, supported by various groups and service provider organizations. Of all permanent residents admitted to Manitoba in 2021, 7.5 percent were admitted as resettled refugees and protected persons (1,235). Manitoba was the intended destination of 2.1 percent of all resettled refugees and protected persons in Canada in 2021, down from 2.4 percent in 2020. Manitoba accounted for 3.7 percent of Canada’s government-assisted refugee admissions (395) and for 4.7 percent of privately sponsored refugee admissions (450) in 2021. These numbers constitute a decrease in the share of government-assisted refugees– and an increase in the proportion of privately sponsored refugees – from 2020, when 4.3 percent of Canada’s government-assisted refugee admissions (165) and 3.6 percent of privately sponsored refugees (190) declared Manitoba their intended destination.
Of all resettled refugees (excludes protected persons) who came to Manitoba from 2019–2021, the top countries of citizenship were Eritrea, Syria, Somalia, Democratic Republic of the Congo, and Ethiopia. This is unchanged from the 2018-2020 period. Stateless persons became among the twelve greatest sources of resettled refugees to Manitoba during the most recent 3-year period, while Iran no longer figures among the Top Twelve source countries for refugees.
Table 8: Manitoba (Province of Intended Destination) - Admissions of Resettled Refugees by Country of Citizenship, 2019–2021
| Country of Citizenship | Number | Percentage |
|---|---|---|
| Eritrea | 905 | 30.0% |
| Syria | 500 | 16.6% |
| Democratic Republic of Somalia | 465 | 15.4% |
| Democratic Republic of the Congo | 270 | 8.9% |
| Ethiopia | 170 | 5.6% |
| Afghanistan | 140 | 4.6% |
| Central African Republic | 85 | 2.8% |
| Iraq | 75 | 2.5% |
| Democratic Republic of Sudan | 70 | 2.3% |
| Pakistan | 50 | 1.7% |
| Stateless | 50 | 1.7% |
| Burundi | 40 | 1.3% |
| All other countries | 200 | 6.6% |
| Total | 3,020 | 100.0% |
4. Destination
Regional Destination (Economic Region)
Immigration continues to benefit regional communities. Since 2019, approximately 33,795 immigrants declared the Winnipeg Economic Region – which includes the City of Winnipeg and Rural Municipality of Headingley – to be their intended destination, while approximately 10,290 immigrants declared other economic regions outside of Winnipeg as their intended destinations. In 2021, 23.3 percent of newcomers had a destination outside of the Winnipeg Economic Region, a decrease of nearly 3.0 percent from 2020. The Winnipeg Economic Region restored its pre-pandemic proportion of immigrant landings (77.4%) in 2021. Manitoba’s South Central Economic Region (e.g. Altona, Carman, Morden, Morris, Winkler, etc.) witnessed a notable decline, falling from 7.0 percent of Manitoba’s immigrant landings to 4.6 percent from 2020 to 2021.
Table 9: Manitoba (Province of Intended Destination) - Admissions of Permanent Residents by Economic Region of Intended Destination, 2019–2021
| Economic Region | 2019 | 2020 | 2021 | ||||||
|---|---|---|---|---|---|---|---|---|---|
| Number | Percentage | Rank | Number | Percentage | Rank | Number | Percentage | Rank | |
| Winnipeg | 14,610 | 77.3% | 1 | 6,380 | 73.9% | 1 | 12,810 | 77.4% | 1 |
| Southwest | 1,710 | 9.0% | 2 | 835 | 9.7% | 2 | 1,600 | 9.7% | 2 |
| South Central | 1,135 | 6.0% | 3 | 600 | 7.0% | 3 | 760 | 4.6% | 3 |
| Southeast | 535 | 2.8% | 4 | 270 | 3.1% | 4 | 555 | 3.4% | 4 |
| North | 305 | 1.6% | 5 | 190 | 2.2% | 5 | 255 | 1.5% | 5 |
| Interlake | 285 | 1.5% | 6 | 145 | 1.7% | 6 | 255 | 1.5% | 6 |
| North Central | 150 | 0.8% | 8 | 120 | 1.4% | 7 | 185 | 1.1% | 7 |
| Parklands | 175 | 0.9% | 7 | 95 | 1.1% | 8 | 140 | 0.8% | 8 |
| Not stated | 10 | – – | 9 | – – | – – | 9 | – – | – – | 9 |
| Total | 18,910 | 100.0% | 8,630 | 100.0% | 16,560 | 100.0% | |||
Community Destination (Municipality)
Since 2019, approximately 33,730 immigrants declared Winnipeg as their intended destination compared to 10,370 who chose one of more than 130 regional communities in Manitoba. From 2019–2021, top regional destinations included Brandon (2,340), Neepawa (1,475), Morden (995), Winkler (790), and Steinbach (665).
In 2021, 3,770 new permanent residents had regional communities outside of Winnipeg as their intended destinations, a two-thirds increase from COVID-affected 2020 (2,270).
Table 10: Manitoba (Province of Intended Destination) - Admissions of Permanent Residents by Top Ten (2021 Rank) Municipality of Intended Destination, 2019–2021
| Municipality | 2019 | 2020 | 2021 | 2019–2021 | ||||||
|---|---|---|---|---|---|---|---|---|---|---|
| Number | Percentage | Rank | Number | Percentage | Rank | Number | Percentage | Rank | Number | |
| Winnipeg | 14,580 | 77.1% | 1 | 6,360 | 73.7% | 1 | 12,790 | 77.2% | 1 | 33,730 |
| Brandon | 875 | 4.6% | 2 | 535 | 6.2% | 2 | 930 | 5.6% | 2 | 2,340 |
| Neepawa | 700 | 3.7% | 3 | 250 | 2.9% | 3 | 520 | 3.1% | 3 | 1,475 |
| Steinbach | 270 | 1.4% | 6 | 125 | 1.4% | 7 | 270 | 1.6% | 4 | 665 |
| Morden | 515 | 2.7% | 4 | 215 | 2.5% | 4 | 265 | 1.6% | 5 | 995 |
| Winkler | 325 | 1.7% | 5 | 210 | 2.4% | 5 | 250 | 1.5% | 6 | 790 |
| Thompson | 245 | 1.3% | 7 | 145 | 1.7% | 6 | 185 | 1.1% | 7 | 575 |
| Portage la Prairie | 110 | 0.6% | 9 | 70 | 0.8% | 8 | 140 | 0.8% | 8 | 320 |
| Altona | 90 | 0.5% | 10 | 60 | 0.7% | 9 | 115 | 0.7% | 9 | 265 |
| Selkirk | 120 | 0.6% | 8 | 45 | 0.6% | 10 | 100 | 0.6% | 10 | 265 |
| Total Top Ten (2021 Rank) | 17,830 | 94.3% | 8,020 | 92.9% | 15,570 | 94.0% | 41,420 | |||
| Other municipalities in Manitoba | 1,080 | 5.7% | 610 | 7.1% | 990 | 6.0% | 93.9% | |||
| Total | 18,910 | 100.0% | 8,630 | 100.0% | 16,560 | 100.0% | 44,100 | |||
5. Source Country
In 2021, India, PR China, Philippines, Nigeria and Brazil ranked among the Top Five source countries for immigrants to Manitoba, consistent with 2020. Together, these five countries represented 66.3 percent of all immigrants to Manitoba in 2021, up from 58.1 percent the year before. Eritrea was Manitoba’s sixth-leading source country for immigrants in 2021; rising from tenth in 2020. In addition, the United States of America and Vietnam became Top Ten source countries in 2021, while the Republic of Korea rejoined the Top Ten after an absence in 2020. Pakistan dropped from sixth to tenth-leading source country for immigrants to Manitoba from 2020 to 2021.
In 2019 and 2020, Top Ten source countries accounted for just over two-thirds of all immigrants declaring Manitoba as their intended destination in Canada. In 2021, the Top Ten accounted for more than three-quarters of all immigrants.
Table 11: Manitoba (Province of Intended Destination) - Admissions of Permanent Residents by Top Ten (2021 Rank) Country of Citizenship, 2019–2021
| Country of Citizenship | 2019 | 2020 | 2021 | ||||||
|---|---|---|---|---|---|---|---|---|---|
| Number | Percentage | Rank | Number | Percentage | Rank | Number | Percentage | Rank | |
| India | 4,625 | 24.5% | 1 | 2,035 | 23.6% | 1 | 5,485 | 33.1% | 1 |
| China, People's Republic of | 1,810 | 9.6% | 3 | 1,050 | 12.2% | 2 | 1,790 | 10.8% | 2 |
| Philippines | 2,585 | 13.7% | 2 | 995 | 11.5% | 3 | 1,640 | 9.9% | 3 |
| Nigeria | 1,625 | 8.6% | 4 | 580 | 6.7% | 4 | 1,585 | 9.6% | 4 |
| Brazil | 585 | 3.1% | 6 | 350 | 4.1% | 5 | 485 | 2.9% | 5 |
| Eritrea | 635 | 3.4% | 5 | 180 | 2.1% | 7 | 400 | 2.4% | 6 |
| United States of America | 320 | 1.7% | 9 | 145 | 1.7% | 9 | 290 | 1.8% | 7 |
| Korea, Republic of | 385 | 2.0% | 8 | 155 | 1.8% | 8 | 290 | 1.8% | 8 |
| Vietnam | 200 | 1.1% | 10 | 105 | 1.2% | 10 | 270 | 1.6% | 9 |
| Pakistan | 445 | 2.4% | 7 | 250 | 2.9% | 6 | 255 | 1.5% | 10 |
| Total Top Ten (2021 Rank) | 13,210 | 69.9% | 5,855 | 67.8% | 12,490 | 75.4% | |||
| Other Countries | 5,700 | 30.1% | 2,775 | 32.2% | 4,070 | 24.6% | |||
| Total | 18,910 | 100.0% | 8,630 | 100.0% | 16,560 | 100.0% | |||
World Region
In 2021, 62.7 percent of immigrants who declared Manitoba as their intended destination in Canada had citizenship in countries located in the Asia & Pacific region, up from 56.3 percent in 2020. Africa and the Middle East accounted for 21.5 percent of all new immigrants to Manitoba in 2021, followed by The Americas [not including the United States] (8.2%), Europe (5.6%), and the United States (1.8%).
Table 12: Manitoba (Province of Intended Destination) - Admissions of Permanent Residents by World Area of Country of Citizenship, 2019–2021
| World Region | 2019 | 2020 | 2021 |
|---|---|---|---|
| Asia & Pacific | 10,620 | 4,860 | 10,385 |
| Africa & Middle East | 5,170 | 2,085 | 3,565 |
| Europe | 1,445 | 760 | 925 |
| Americas | 1,315 | 765 | 1,365 |
| United States of America | 320 | 145 | 290 |
| Stateless | 40 | 15 | 25 |
| Total | 18,910 | 8,630 | 16,560 |
6. Demographics
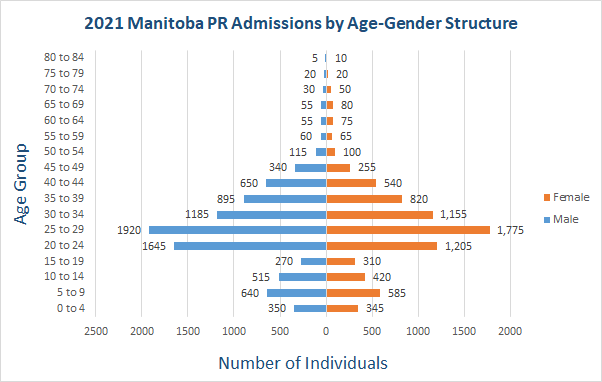
Age-Gender Structure
Newcomers are important contributors to Manitoba’s labour force and population growth. Male and female numbers were roughly equal, though most age groups saw more male immigrants than female.
7. Official Languages
Mother Tongue
People arrive in Manitoba from all over the world with the ability to communicate in many languages other than English or French. In 2021, permanent residents with Manitoba as their intended destination declared an ability to communicate in over 160 languages. The top languages spoken were Punjabi (25.0%), Chinese (11.7%), Tagalog (8.8%), Yoruba (5.3%), and Spanish (3.8%). The percentage of Punjabi speakers increased significantly from 2020 to 2021, rising from 14 percent to 25 percent of all permanent residents admitted to Manitoba. There has also been a marked decline in absolute numbers of Arabic-speaking immigrants landing in Manitoba in recent years.
Table 13: Manitoba (Province of Intended Destination) - Admissions of Permanent Residents by Top Ten (2021 Rank) Language Spoken, 2019–2021
| Language Spoken | 2019 | 2020 | 2021 | ||||||
|---|---|---|---|---|---|---|---|---|---|
| Number | Percentage | Rank | Number | Percentage | Rank | Number | Percentage | Rank | |
| Punjabi | 3,090 | 16.3% | 1 | 1,210 | 14.0% | 1 | 4,135 | 25.0% | 1 |
| Chinese | 1,910 | 10.1% | 3 | 1,130 | 13.1% | 2 | 1,940 | 11.7% | 2 |
| Tagalog | 2,120 | 11.2% | 2 | 865 | 10.0% | 3 | 1,460 | 8.8% | 3 |
| Yoruba | 920 | 4.9% | 6 | 285 | 3.3% | 8 | 875 | 5.3% | 4 |
| English | 1,065 | 5.6% | 4 | 470 | 5.4% | 5 | 860 | 5.2% | 5 |
| Spanish | 355 | 1.9% | 10 | 260 | 3.0% | 9 | 635 | 3.8% | 6 |
| Gujarati | 715 | 3.8% | 7 | 445 | 5.2% | 6 | 615 | 3.7% | 7 |
| Portuguese | 605 | 3.2% | 8 | 360 | 4.2% | 7 | 495 | 3.0% | 8 |
| Arabic | 935 | 4.9% | 5 | 565 | 6.5% | 4 | 470 | 2.8% | 9 |
| Hindi | 440 | 2.3% | 9 | 210 | 2.4% | 10 | 440 | 2.7% | 10 |
| Total Top Ten (2021 Rank) | 12,155 | 64.3% | 5,800 | 67.2% | 11,925 | 72.0% | |||
| Other Languages | 6,755 | 35.7% | 2,830 | 32.8% | 4,635 | 28.0% | |||
| Total | 18,910 | 100.0% | 8,630 | 100.0% | 16,560 | 100.0% | |||
English and French Official Languages Spoken
In 2021, the percentage of Manitoba’s immigrants who declared English as their official language spoken was 86.5 percent (14,325), up from 80.0 percent in 2020 (6,905).
Manitoba was the intended destination of 490 immigrants who declared either French or both French and English as their official languages in 2021, representing 3.0 percent of the province’s immigrant admissions. This is a marked decline from 2020, which saw 6.1 percent of immigrants to Manitoba declare French or both French and English as their official languages spoken. Though 2020 was an anomaly, landings of permanent residents with knowledge of French or both French and English accounted for 4.3 percent of all permanent residents admitted in 2019. Though 2021 saw a proportional decline in the number of French speakers immigrating to Manitoba, it is nevertheless in line with the 2017 and 2018 figures of 3.1 percent and 2.6 per cent, respectively.
Overall, 1,840 immigrants destined for Manitoba declared an ability to speak in French during the 2019–2021 period. This represents 4.2 percent of all permanent resident admissions to Manitoba during the most recent three-year period, up from 4.1 percent from 2018 – 2020. In 2021, 2.7 percent of all MPNP nominations were francophone, up from 2.2 percent in 2020. Just over 60 percent of immigrants (permanent residents) destined for Manitoba – who declared either French or both French and English as their knowledge of official languages – were provincial nominees in 2021, down from 70.8 percent in 2020.
Table 14: Manitoba (Province of Intended Destination) - Admissions of Permanent Residents by Official Language Spoken, 2019–2021
| Official Language | 2019 | 2020 | 2021 |
|---|---|---|---|
| English | 14,950 | 6,905 | 14,325 |
| French | 300 | 195 | 120 |
| Both French and English | 520 | 335 | 370 |
| Neither | 2,850 | 1,110 | 1,505 |
| Not stated | 290 | 85 | 240 |
| Total | 18,910 | 8,630 | 16,560 |
8. Education, Occupation, and Skill Level
In 2021, just over 50 percent of permanent residents admitted to Manitoba aged 25 and older had a bachelor’s degree or higher, compared to 47.9 percent in 2020 and 51.1 percent in 2019. Education levels of permanent residents with Manitoba as intended destination have been mostly consistent over the past three years. The number of immigrants declaring secondary school or less as their education qualification declined from nearly 15 percent in 2019 to just over 12 percent in 2020 and 2021. The number of immigrants opting not to declare their education qualification increased from 14.7 percent in 2019 to more than 18 percent in 2020 and 2021. It is unclear what accounts for the growth in this category at this time.
Table 15: Manitoba (Province of Intended Destination) - Admissions of Permanent Residents Aged 25 Years and Over by Education Qualification, 2019–2021
| Level of Education | 2019 | 2020 | 2021 | |||
|---|---|---|---|---|---|---|
| None | 160 | 1.3% | 50 | 0.9% | 95 | 0.9% |
| Secondary or Less | 1,785 | 14.7% | 710 | 12.4% | 1,245 | 12.1% |
| Trade Diploma or Certificate | 710 | 5.9% | 360 | 6.3% | 585 | 5.7% |
| Non-University Certificate or Diploma | 790 | 6.5% | 380 | 6.6% | 630 | 6.1% |
| Post-Secondary - No Degree | 685 | 5.7% | 375 | 6.6% | 690 | 6.7% |
| Bachelor's Degree | 4,145 | 34.2% | 1,850 | 32.3% | 3,435 | 33.4% |
| Post-Graduate - No Degree | 385 | 3.2% | 195 | 3.4% | 415 | 4.0% |
| Master's Degree | 1,570 | 13.0% | 640 | 11.2% | 1,235 | 12.0% |
| Doctorate - PhD | 95 | 0.8% | 55 | 1.0% | 80 | 0.8% |
| Not stated | 1,785 | 14.7% | 1,110 | 19.4% | 1,860 | 18.1% |
| Total | 12,115 | 100.0% | 5,720 | 100.0% | 10,275 | 100.0% |
Occupation
In 2021, 62.5 percent of principal applicants under the economic category were considered highly skilled (NOC 0, A and B); down from 66.4 percent in 2020. By comparison, 36.4 percent of Economic Class principal applicants were considered low skilled (NOC C and D) in 2021; up from 32.7 percent in 2020. The Manitoba Bureau of Statistics’ Spotlight on Labour Shortages notes that the surge in job vacancies is more concentrated in low-paying occupations, and that among occupations with the largest growth in vacancies, 7 in 10 are low-paying jobs.[2] The proportional increase in low-skilled immigrant arrivals in 2021 seems to be aligned with Manitoba’s current labour market needs.
Skilled and Technical professions (NOC B) and Intermediate and Clerical positions (NOC C) continue to be the top occupations of economic immigrants (principal applicants only) to Manitoba, accounting for 71 percent of the total in 2021.
Table 16: Manitoba (Province of Intended Destination) - Admissions of Economic Permanent Residents (Principal Applicant Only) by Skill Level, 2021
| Skill Level | Number | Percentage |
|---|---|---|
| 0 - Managerial | 505 | 6.7% |
| A - Professionals | 830 | 10.9% |
| B - Skilled and Technical | 3,410 | 44.9% |
| C - Intermediate and Clerical | 1,980 | 26.1% |
| D - Elemental and Labourers | 780 | 10.3% |
| Intending to work* | 45 | 0.6% |
| Not intending to work* | 20 | 0.3% |
| Not stated | 20 | 0.3% |
| Total | 7,590 | 100.0% |
The table represents skill level for Economic Immigrant Principal Applicants only, including provincial nominees, federally selected skilled workers and tradespeople, federal business candidates, live-in caregivers, RNIP candidates, federal Canadian Experience Class, and the 2021 temporary TR to PR pathway.
*Intending to work includes new workers (15 years of age or older); not intending to work includes other non-workers (15 years of age or older) and students (15 years of age or older).
Skill Type Category
In 2021, sales and service professions grew from nearly one-third of the assessed occupations of Manitoba Economic Class Permanent Residents in 2019 (31.0%) and 2020 (31.7%) to almost 40% in 2021. The increased percentage of sales and service workers appears to have been partly driven by the MPNP’s focus on nominating Skilled Workers in Manitoba during the pandemic. Skilled Workers in Manitoba accounted for 79.4 percent of nominations in 2020 and for 71.2 percent in 2021, up from 54.5 percent in 2019. The temporary TR to PR pathway and Canadian Experience Class also served as key avenues allowing temporary foreign workers employed in sales and service occupations to attain permanent resident status in Manitoba.
Professions in sales and services; business, finance and administration; natural and applied sciences; and trades, transport and equipment operation accounted for 77.1 percent of assessed occupations of Economic Class permanent residents admitted to Manitoba in 2021. This marks an increase from 2020 (72.2%) and 2019 (67.3%).
Table 17: Manitoba (Province of Intended Destination) - Admissions of Economic Permanent Residents (Principal Applicant Only) by Intended Occupation (1-Digit NOC 2011), 2019–2021
| Occupations | 2019 | 2020 | 2021 | |||
|---|---|---|---|---|---|---|
| Number | Percentage | Number | Percentage | Number | Percentage | |
| 0 - Management occupations | 575 | 8.9% | 250 | 7.6% | 495 | 6.5% |
| 1 - Business, finance and administration occupations | 970 | 15.0% | 515 | 15.7% | 1095 | 14.4% |
| 2 - Natural and applied sciences and related occupations | 755 | 11.6% | 480 | 14.6% | 760 | 10.0% |
| 3 - Health occupations | 230 | 3.5% | 100 | 3.0% | 135 | 1.8% |
| 4 - Occupations in education, law and social, community and government services | 410 | 6.3% | 215 | 6.5% | 370 | 4.9% |
| 5 - Occupations in art, culture, recreation and sport | 75 | 1.2% | 30 | 0.9% | 75 | 1.0% |
| 6 - Sales and service occupations | 2,010 | 31.0% | 1,040 | 31.7% | 3,025 | 39.9% |
| 7 - Trades, transport and equipment operators and related occupations | 630 | 9.7% | 335 | 10.2% | 970 | 12.8% |
| 8 - Natural resources, agriculture and related production occupations | 85 | 1.3% | 40 | 1.2% | 85 | 1.1% |
| 9 - Occupations in manufacturing and utilities | 505 | 7.8% | 210 | 6.4% | 485 | 6.4% |
| Not stated | 35 | 0.5% | 15 | 0.5% | 20 | 0.3% |
| Other* | 195 | 3.0% | 50 | 1.5% | 75 | 1.0% |
| Total | 6,485 | 100.0% | 3,285 | 100.0% | 7,590 | 100.0% |
The table represents skill level for Economic Immigrant Principal Applicants only, including provincial nominees, federally selected skilled workers and tradespeople, federal business candidates, live-in caregivers, RNIP candidates, federal Canadian Experience Class, and the 2021 temporary TR to PR pathway.
*Other category includes principal applicants not intending to work and other occupations not covered by a NOC code.
9. Temporary Foreign Workers and International Students
Temporary Residents
In Manitoba, temporary residents who have worked for more than six months on a full-time, continuous basis – or who have graduated from a post-secondary program in the province – have pathways to apply to the MPNP to become permanent residents. A total of 11,565 foreign workers who received work permits through the federal International Mobility Program (IMP) declared Manitoba as their intended destination in 2021. This marks a 25.7 percent increase from 2020, a 27.6 percent increase from pre-pandemic 2019, and a 187 percent increase from 2012. There were also 1,110 Temporary Foreign Workers (TFWs) issued work permits through the Government of Canada’s Temporary Foreign Worker Program (TFWP) – which requires a Labour Market Impact Assessment (LMIA) – who declared Manitoba their intended destination in 2021. This marks an 18.1 percent increase from 2020, a 15.6 percent decline from pre-pandemic 2019, and a 40.3 percent decline from 2012.
The past decade has seen a reorientation in Canadian foreign workers, with those arriving through an LMIA being steadily scaled down alongside rapid growth in issuance of work permits through the IMP. These changes are most likely attributable to the notable growth in study permits issued during the past ten years. This has led to a significant increase in the number of international students studying at Manitoban educational institutions and has resulted in a growing number of foreign workers in Manitoba on post-graduation work permits (which are issued through the IMP). The significant increase in IMP work permit holders is also attributable to growth in work permits issued to spouses of students and foreign workers.
The decline in TFWs obtaining work permits through the TFWP may be a reflection of the growth in opportunities for persons abroad to complete post-secondary studies at Canadian institutions since 2012. It may be more advantageous for a potential immigrant to complete a post-secondary program of interest, obtain an open work permit, and gain full-time Canadian (Manitoban) work experience with any employer in any occupation after graduation. By comparison, the TFWP requires a potential TFW to locate an employer willing to pay $1,000 through the LMIA process. The TFW is then required to work for that employer – in the position and location specified in the work permit – until they gain permanent residence in Canada (if they choose to pursue it). By comparison, Manitoban employers can hire foreign workers on open post-graduation work permits at no extra cost. Work permits obtained through the IMP offer greater flexibility for foreign workers than those obtained through an LMIA process. Together with Manitoba’s current and anticipated labour shortages – and the federal Trade Commissioner Service’s goal of intensifying its efforts to grow and diversify Canada’s international education sector[3] – these trends are likely to continue for the foreseeable future.
Table 18: Manitoba (Province of Destination) - Work Permit Holders by Program and Year in which Permit(s) Became Effective*, 2012–2021
| Program | 2012 | 2013 | 2014 | 2015 | 2016 | 2017 | 2018 | 2019 | 2020 | 2021 |
|---|---|---|---|---|---|---|---|---|---|---|
| Temporary Foreign Worker Program Work Permit Holders | 1,860 | 1,795 | 1,380 | 885 | 875 | 770 | 1,170 | 1,315 | 940 | 1,110 |
| International Mobility Program Work Permit Holders | 4,025 | 4,715 | 5,045 | 5,065 | 6,715 | 7,205 | 8,125 | 9,060 | 9,200 | 11,565 |
*This term refers to permit holders with a valid permit that was signed in the given calendar year. The total unique count may not equal the sum of permit holders in each program, as an individual may hold more than one type of permit in the same year.
There has been a notable decline in work permits issued through the TFWP (LMIA process) in connection with Brandon and Winnipeg as worker destinations. Beginning in 2014, consistently more of these types of permits were issued to TFWs destined for municipalities outside of Manitoba’s two largest urban areas. Employers in Manitoba’s regional municipalities are more reliant on LMIAs and the TFWP to attract workers, while employers in Brandon and Winnipeg seem to increasingly source foreign workers through the IMP; namely international student graduates on post-graduation work permits and spouses of international students, international student graduates, and other foreign workers (on open spousal work permits).
Table 19: Manitoba (Province of Destination) - Temporary Foreign Worker Program (TFWP) Work Permit Holders with Labour Market Impact Assessment (LMIA) by Census Metropolitan Area of Destination and Year in which Permit(s) Became Effective*, 2012–2021
| Census Metropolitan Area | 2012 | 2013 | 2014 | 2015 | 2016 | 2017 | 2018 | 2019 | 2020 | 2021 |
|---|---|---|---|---|---|---|---|---|---|---|
| Brandon | 315 | 245 | 220 | 180 | 140 | 135 | 130 | 140 | – – | 15 |
| Winnipeg | 820 | 860 | 520 | 255 | 270 | 255 | 280 | 375 | 375 | 400 |
| Other | 725 | 690 | 640 | 450 | 465 | 380 | 760 | 800 | 565 | 695 |
| Total Unique TFWP Work Permit Holders | 1,860 | 1,795 | 1,380 | 885 | 875 | 770 | 1,170 | 1,315 | 940 | 1,110 |
*This term refers to permit holders with a valid permit that was signed in the given calendar year. The total unique count may not equal the sum of permit holders in each program, as an individual may hold more than one type of permit in the same year.
The table below highlights the growth in the number of foreign workers in Manitoba who have been issued work permits obtained through the IMP over the past 10 years. IMP work permits with Brandon as intended destination increased by 167 percent from 2012 to 2021, while IMP permits with Winnipeg as intended destination grew by over 200 percent over the same period. Though the increase in IMP work permits over the past decade are mostly linked to Brandon and Winnipeg, IMP work permit holders destined for other Manitoba regional municipalities also increased markedly from 2012 to 2021, rising from 855 permits in 2012 to 1,805 in 2021 (a 111% increase). There is a key difference in what is driving growth in IMP holders between Brandon and Winnipeg versus the rest of Manitoba. In Brandon and Winnipeg, it appears to be an increase in post-graduation work permit and open spousal work permit holders that are primarily responsible for the past decade’s growth. Outside of Brandon and Winnipeg, it is an increase in issuance of work permits through Canada-Provincial/Territorial Agreements that is most responsible for the growth in IMP permit holders since 2012. Work permits issued pursuant to Canada-Provincial/Territorial Agreements are ordinarily issued to provincial nominees who have an employer that has paid the federal $230.00 compliance fee through the IMP. On a balance of probabilities, these would mainly be candidates who received MPNP nominations through the program’s Employer Direct Pathway after having a foreign worker recruitment request approved by the Manitoba government unit responsible for employer services.
In sum, Manitoba employers in regional municipalities mostly rely on the TFWP and Manitoba government employer services to source foreign workers. Employers in Brandon and Winnipeg mainly seem to rely on post-graduation work permit and spousal open work permit holders as sources of foreign workers.
Table 20: Manitoba (Province of Destination) - International Mobility Program (IMP) Work Permit Holders by Census Metropolitan Area of Destination and Year in which Permit(s) Became Effective*, 2012–2021
| Census Metropolitan Area | 2012 | 2013 | 2014 | 2015 | 2016 | 2017 | 2018 | 2019 | 2020 | 2021 |
|---|---|---|---|---|---|---|---|---|---|---|
| Brandon | 170 | 195 | 265 | 195 | 190 | 245 | 250 | 295 | 340 | 455 |
| Winnipeg | 3,000 | 3,380 | 3,260 | 3,550 | 5,110 | 5,450 | 6,315 | 7,000 | 7,300 | 9,305 |
| Other | 855 | 1,140 | 1,520 | 1,320 | 1,415 | 1,510 | 1,560 | 1,765 | 1,560 | 1,805 |
| Total Unique IMP Work Permit Holders | 4,025 | 4,715 | 5,045 | 5,065 | 6,715 | 7,205 | 8,125 | 9,060 | 9,200 | 11,565 |
*This term refers to permit holders with a valid permit that was signed in the given year.
International Students
In 2021, the number of study permit holders declaring Manitoba as their intended destination was 12,680. This constitutes a 51.2 percent increase from pandemic-affected 2020 (8,385). Most international students (11,720, corresponding with 92.4%) were issued permits in connection with educational institutions in Winnipeg in 2021, a proportional decrease from the previous year (7,830, amounting to 93.4%).
Table 21: Manitoba (Province of Destination) - Study Permit Holders by Census Metropolitan Area of Destination and Year in which Permit(s) Became Effective*, 2012–2021
| Census Metropolitan Area | 2012 | 2013 | 2014 | 2015 | 2016 | 2017 | 2018 | 2019 | 2020 | 2021 |
|---|---|---|---|---|---|---|---|---|---|---|
| Brandon | 150 | 175 | 160 | 240 | 290 | 410 | 495 | 610 | 315 | 585 |
| Winnipeg | 4,450 | 5,235 | 5,645 | 6,365 | 7,955 | 9,655 | 11,155 | 11,020 | 7,830 | 11,720 |
| Other | 375 | 315 | 340 | 320 | 330 | 385 | 335 | 390 | 240 | 375 |
| Total Unique Study Permit Holders | 4,975 | 5,725 | 6,145 | 6,925 | 8,575 | 10,450 | 11,985 | 12,020 | 8,385 | 12,680 |
*This term refers to permit holders with a valid study permit that was signed and issued in each calendar year noted above.
In 2021, the top source countries of international students to Manitoba were India (26.5%), PR China (12.9%), Nigeria (10.0%), Bangladesh (6.6%), and Hong Kong SAR (4.7%). This is similar to what was observed in 2019.
The number of study permit holders from Hong Kong SAR in Manitoba increased markedly from 2020 to 2021, rising from 245 to 595 (by 243%), as did the number of study permit holders from the Philippines, Ecuador and Colombia (a more than 300% year-over-year increase). 2021 also saw a notable decline in the proportion of study permit holders from PR China, thought to be due to reduced mobility stemming from the outbreak of COVID-19.
Table 22: Manitoba (Province of Destination) - Study Permit Holders by Top Ten (2021 Rank) Country of Citizenship and Year in which Permit(s) Became Effective*, 2019–2021
| Country of Citizenship | 2019 | 2020 | 2021 | ||||||
|---|---|---|---|---|---|---|---|---|---|
| Number | Percentage | Rank | Number | Percentage | Rank | Number | Percentage | Rank | |
| India | 2,995 | 24.9% | 1 | 1,695 | 20.2% | 2 | 3,355 | 26.5% | 1 |
| China, People's Republic of | 2,565 | 21.3% | 2 | 1,895 | 22.6% | 1 | 1,630 | 12.9% | 2 |
| Nigeria | 1155 | 9.6% | 3 | 935 | 11.2% | 3 | 1,265 | 10.0% | 3 |
| Bangladesh | 930 | 7.7% | 4 | 640 | 7.6% | 4 | 840 | 6.6% | 4 |
| Hong Kong SAR | 135 | 1.1% | 9 | 245 | 2.9% | 6 | 595 | 4.7% | 5 |
| Philippines | 175 | 1.5% | 7 | 120 | 1.4% | 8 | 405 | 3.2% | 6 |
| Vietnam | 470 | 3.9% | 5 | 405 | 4.8% | 5 | 380 | 3.0% | 7 |
| Ecuador | 95 | 0.8% | 10 | 95 | 1.1% | 9 | 300 | 2.4% | 8 |
| Pakistan | 220 | 1.8% | 6 | 200 | 2.4% | 7 | 295 | 2.3% | 9 |
| Colombia | 145 | 1.2% | 8 | 85 | 1.0% | 10 | 270 | 2.1% | 10 |
| Total Top Ten (2021 Rank) | 8,880 | 73.9% | 6,315 | 75.3% | 9,335 | 73.6% | |||
| Other Countries of Citizenship | 3,140 | 26.1% | 2,070 | 20.7% | 3,345 | 26.4% | |||
| Total Unique Study Permit Holders | 12,020 | 100.0% | 8,385 | 100.0% | 12,680 | 100.0% | |||
*This term refers to permit holders with a valid study permit that was signed and issued in each calendar year noted above. Rank is based on the highest number of study permits by country of citizenship.
The number of study permit holders who declared Manitoba their intended destination in Canada who held a valid permit as of December 31, 2021 was 18,815. This constitutes a 12.8 percent increase from pandemic-affected 2020 (16,685). Most international students with valid study permits had declared that they were pursuing studies at educational institutions in Winnipeg, as of year-end 2021 (17,545 – 93.3%), consistent with the previous year.
Table 23: Manitoba (Province of Destination) - Study Permit Holders on December 31st by Census Metropolitan Area of Destination*, 2012–2021
| Census Metropolitan Area | 2012 | 2013 | 2014 | 2015 | 2016 | 2017 | 2018 | 2019 | 2020 | 2021 |
|---|---|---|---|---|---|---|---|---|---|---|
| Brandon | 245 | 285 | 295 | 355 | 450 | 585 | 715 | 925 | 735 | 840 |
| Winnipeg | 7,190 | 8,685 | 10,005 | 11,050 | 12,840 | 15,280 | 17,395 | 17,830 | 15,565 | 17,545 |
| Other | 520 | 500 | 515 | 485 | 480 | 560 | 525 | 545 | 385 | 430 |
| Total Unique Study Permit Holders | 7,955 | 9,470 | 10,815 | 11,890 | 13,770 | 16,425 | 18,635 | 19,300 | 16,685 | 18,815 |
*Defined by the intended destination as specified on the permit. When the intended destination is not specified, the last known address of the permit holder is used, as of December 31st of the given year.
The top source countries of international students to Manitoba – based on valid study permit holders at the end of 2021 – were India (27.9%), PR China (13.2%), Nigeria (10.9%), Bangladesh (6.8%), and Vietnam (3.8%). This is comparable to what was observed in 2019, save for a notable ~5.5 percent decline in the proportion of study permit holders with citizenship in PR China.
Table 24: Manitoba (Province of Destination) - Study Permit Holders on December 31st by Top Ten (2021 Rank) Country of Citizenship, 2019–2021
| Country of Citizenship | 2019 | 2020 | 2021 | ||||||
|---|---|---|---|---|---|---|---|---|---|
| Number | Percentage | Rank | Number | Percentage | Rank | Number | Percentage | Rank | |
| India | 5,035 | 26.1% | 1 | 4,395 | 26.3% | 1 | 5,240 | 27.9% | 1 |
| China, People's Republic of | 3,765 | 19.5% | 2 | 3,105 | 18.6% | 2 | 2,485 | 13.2% | 2 |
| Nigeria | 1,855 | 9.6% | 3 | 1,745 | 10.5% | 3 | 2,050 | 10.9% | 3 |
| Bangladesh | 1,305 | 6.8% | 4 | 1,200 | 7.2% | 4 | 1,285 | 6.8% | 4 |
| Vietnam | 920 | 4.8% | 5 | 800 | 4.8% | 5 | 720 | 3.8% | 5 |
| Hong Kong SAR | 205 | 1.1% | 9 | 325 | 1.9% | 8 | 665 | 3.5% | 6 |
| Pakistan | 390 | 2.0% | 6 | 355 | 2.1% | 6 | 435 | 2.3% | 7 |
| Philippines | 205 | 1.1% | 9 | 190 | 1.1% | 10 | 420 | 2.2% | 8 |
| United States of America | 375 | 1.9% | 7 | 330 | 2.0% | 7 | 370 | 2.0% | 9 |
| Iran | 305 | 1.6% | 8 | 285 | 1.7% | 9 | 335 | 1.8% | 10 |
| Total Top Ten (2021 Rank) | 14,360 | 74.4% | 12,735 | 76.3% | 14,000 | 74.4% | |||
| Other Countries of Citizenship | 4,940 | 25.6% | 3,950 | 23.7% | 4,815 | 25.6% | |||
| Total Unique Study Permit Holders | 19,300 | 100.0% | 16,685 | 100.0% | 18,815 | 100.0% | |||
Footnotes
[1] Statistics Canada. Population estimates, quarterly. www150.statcan.gc.ca/t1/tbl1/en/tv.action?pid=1710000901. Accessed January 31, 2023.
[2] Manitoba Bureau of Statistics. Spotlight on Labour Shortages. August 4, 2022.
[3] Government of Canada. Building on Success: International Education Strategy 2019 – 2024: www.international.gc.ca/education/assets/pdfs/ies-sei/Building-on-Success-International-Education-Strategy-2019-2024.pdf. Accessed September 9, 2022.