Introduction
Year after year, immigrants contribute significantly to Manitoba’s economy, labour market, and social fabric. Despite the challenges of COVID-19, our province strives, and is proud, to continue being a destination of choice for many immigrants.
Data in this report was created by the Province of Manitoba using IRCC Q4 2020 immigration data (for permanent residents) and IRCC Q1 2021 immigration data (for temporary residents), and has been approved by IRCC for public release. Please note that all values between 0 and 5 are shown as “– –”. This is done to prevent individuals from being identified when IRCC data is compiled and compared to other publicly available statistics. All other values are rounded to the closest multiple of 5 for the same reason. Data may not sum to the totals indicated because rounded figures were used. Data are preliminary and subject to change.
1. Immigration Trends
Manitoba has been steadily contributing to its population growth by welcoming 163,650 immigrants from 2010 to 2020. By Q4 2020, Manitoba was estimated to have more than 1.38 million people, accounting for about 3.6% of Canada’s total population of just over 38 million.[1] In 2020, 8,620 immigrants who chose Manitoba as their immigration destination became permanent residents, representing 4.7% of total immigration to Canada. This marks a decrease of 10,290 permanent resident admissions from 2019 (a 54.4% annual reduction), primarily due to travel restrictions associated with COVID-19.
The Manitoba Provincial Nominee Program (MPNP) continues to be the main tool for bringing skilled immigrants to meet Manitoba’s labour and economic development needs. On an annual basis, the MPNP nominates skilled workers, international student graduates, and business investors who are best suited to contribute to Manitoba’s economy.
Between 2010 and 2020, Provincial Nominee admissions represented close to 70% of all immigrants who declared Manitoba as their intended destination, and approximately 92% of all economic immigrants to the province. In 2020, Manitoba’s Provincial Nominees accounted for 89.7% of all economic immigrants (5,835) while 10.2% of immigrants (665) were to have arrived under other, federal economic streams.
Table 1: Manitoba (Province of Intended Destination) - Admissions of Permanent Residents by Immigration Category, 2010–2020
| Immigration Category | 2010 | 2011 | 2012 | 2013 | 2014 | 2015 | 2016 | 2017 | 2018 | 2019 | 2020 | Total |
|---|---|---|---|---|---|---|---|---|---|---|---|---|
| Sponsored Family | 1,455 | 1,490 | 1,800 | 2,000 | 1,845 | 1,850 | 2,375 | 2,475 | 2,745 | 3,160 | 1,490 | 22,685 |
| Skilled Workers | 900 | 620 | 660 | 620 | 390 | 715 | 490 | 295 | 540 | 620 | 295 | 6,135 |
| Provincial Nominees | 12,180 | 12,355 | 9,540 | 8,865 | 12,195 | 10,260 | 9,960 | 9,430 | 9,895 | 12,545 | 5,835 | 113,055 |
| Other Economic | 200 | 190 | 140 | 130 | 275 | 275 | 245 | 335 | 440 | 485 | 370 | 3,080 |
| Resettled Refugees & Protected Persons in Canada | 1,030 | 1,305 | 1,140 | 1,460 | 1,495 | 1,770 | 3,730 | 2,130 | 1,565 | 2,045 | 600 | 18,275 |
| Other | 50 | 20 | 45 | 50 | 30 | 35 | 25 | 35 | 50 | 50 | 35 | 425 |
| Total | 15,810 | 15,975 | 13,330 | 13,120 | 16,235 | 14,900 | 16,820 | 14,705 | 15,225 | 18,910 | 8,620 | 163,650 |
In 2020, Canada welcomed 184,370 new permanent residents, which constitutes a decrease of 45.9% from 2019. By immigration category, the largest groups of permanent residents who settled in Canada in 2020 were family class (26.6%), Provincial Nominees (21.0%), federal skilled workers (19.4%), other economic immigrants (17.3%), and refugees (13.7%).
Table 2: Canada - Admissions of Permanent Residents by Immigration Category, 2010–2020
| Immigration Category | 2010 | 2011 | 2012 | 2013 | 2014 | 2015 | 2016 | 2017 | 2018 | 2019 | 2020 | Total |
|---|---|---|---|---|---|---|---|---|---|---|---|---|
| Sponsored Family | 65,550 | 61,330 | 69,870 | 83,375 | 67,645 | 65,485 | 78,000 | 82,470 | 85,170 | 91,310 | 49,165 | 799,370 |
| Skilled Workers | 119,380 | 88,760 | 91,415 | 83,225 | 67,575 | 70,135 | 65,610 | 47,415 | 71,235 | 77,855 | 35,800 | 818,400 |
| Provincial Nominees | 36,435 | 38,420 | 40,885 | 39,905 | 47,625 | 44,535 | 46,180 | 49,730 | 62,440 | 68,645 | 38,720 | 513,525 |
| Other Economic | 31,140 | 28,910 | 28,450 | 25,130 | 49,995 | 55,750 | 44,240 | 62,145 | 52,690 | 50,155 | 31,905 | 460,515 |
| Resettled Refugees & Protected Persons in Canada | 24,670 | 27,880 | 23,085 | 24,005 | 23,460 | 31,615 | 58,550 | 41,120 | 45,495 | 48,530 | 25,380 | 373,790 |
| Other | 3,515 | 3,400 | 4,065 | 3,400 | 4,005 | 4,315 | 3,790 | 3,630 | 4,025 | 4,680 | 3,405 | 42,240 |
| Total | 280,695 | 248,705 | 257,775 | 259,040 | 260,305 | 271,835 | 296,370 | 286,510 | 321,055 | 341,175 | 184,370 | 3,007,835 |
2. Immigration Levels
Immigration to Canada decreased by 46.0% from 341,175 in 2019 to 184,370 in 2020.
Table 3: Canada - Admissions of Permanent Residents by Immigration Category, 2018–2020
| Immigration Category | 2018 | 2019 | 2020 | |||
|---|---|---|---|---|---|---|
| Number | Percentage | Number | Percentage | Number | Percentage | |
| Sponsored Family | 85,170 | 26.5% | 91,310 | 26.8% | 49,165 | 26.7% |
| Skilled Workers | 71,235 | 22.2% | 77,855 | 22.8% | 35,800 | 19.4% |
| Other Federal Economic | 52,690 | 16.4% | 50,155 | 14.7% | 31,905 | 17.3% |
| Provincial Nominee** | 62,440 | 19.4% | 68,645 | 20.1% | 38,720 | 21.0% |
| Resettled Refugees & Protected Persons in Canada | 45,495 | 14.2% | 48,530 | 14.2% | 25,380 | 13.8% |
| Other* | 4,025 | 1.3% | 4,680 | 1.4% | 3,405 | 1.8% |
| Total | 321,055 | 100% | 341,175 | 100% | 184,370 | 100% |
| Difference from previous year | 34,545 | 12.1% | 20,120 | 6.3% | -156,805 | -46.0% |
*Includes Humanitarian and Compassionate cases, Public Policy cases, and Other immigrants not included elsewhere (permit holders applying for permanent residence).
**Provincial Nominees are a subcategory of the Economic Class.
Immigration by Province or Territory
In 2020, the top destinations for new permanent residents were Ontario, British Columbia, Quebec, Alberta, and Manitoba. Though all provinces/territories experienced a decrease in the absolute number of permanent resident admissions, the proportion of admissions relative to total immigration to Canada increased in Quebec and British Columbia, and decreased in all other provinces/territories except Ontario, which remained steady at ~45%. Permanent resident admissions with Manitoba as an intended destination decreased to 4.7% in 2020 from 5.5% a year earlier.
Table 4: Canada - Admissions of Permanent Residents by Province/Territory of Intended Destination, 2018–2020
| Province/Territory | 2018 | 2019 | 2020 | |||
|---|---|---|---|---|---|---|
| Number | Percentage | Number | Percentage | Number | Percentage | |
| Newfoundland and Labrador | 1,530 | 0.5% | 1,850 | 0.5% | 905 | 0.5% |
| Prince Edward Island | 2,135 | 0.7% | 2,445 | 0.7% | 1,290 | 0.7% |
| Nova Scotia | 5,965 | 1.9% | 7,580 | 2.2% | 3,505 | 1.9% |
| New Brunswick | 4,610 | 1.4% | 6,000 | 1.8% | 2,890 | 1.6% |
| Quebec | 51,125 | 15.9% | 40,565 | 11.9% | 25,195 | 13.7% |
| Ontario | 137,440 | 42.8% | 153,395 | 45.0% | 82,850 | 44.9% |
| Manitoba | 15,225 | 4.7% | 18,910 | 5.5% | 8,620 | 4.7% |
| Saskatchewan | 15510 | 4.8% | 15,855 | 4.6% | 7,390 | 4.0% |
| Alberta | 42,020 | 13.1% | 43,690 | 12.8% | 22,935 | 12.4% |
| British Columbia | 44,870 | 14.0% | 50,230 | 14.7% | 28,470 | 15.4% |
| Yukon | 305 | 0.1% | 400 | 0.1% | 175 | 0.1% |
| Northwest Territories | 280 | 0.1% | 195 | 0.1% | 125 | 0.1% |
| Nunavut | 30 | 0.0% | 40 | 0.0% | 20 | 0.0% |
| Not stated | 10 | 0.0% | 15 | 0.0% | – – | – – |
| Total | 321,055 | 100.0% | 341,175 | 100.0% | 184,370 | 100.0% |
Manitoba saw a year-on-year increase in the proportion of Provincial Nominee admissions compared to the previous year (67.7% in 2020 versus 66.3% in 2019). Provincial nominees remain Manitoba’s most important source of immigrants. Also of note, Manitoba saw a decrease in refugee landings from 10.8% in 2019 to 7.0% in 2020.
Table 5: Manitoba (Province of Intended Destination) - Admissions of Permanent Residents by Immigration Category, 2018–2020
| Immigration Category | 2018 | 2019 | 2020 | |||
|---|---|---|---|---|---|---|
| Number | Percentage | Number | Percentage | Number | Percentage | |
| Sponsored Family | 2,745 | 18.0% | 3,160 | 16.7% | 1,490 | 17.3% |
| Skilled Workers | 540 | 3.5% | 620 | 3.3% | 295 | 3.4% |
| Other Federal Economic Class* | 440 | 2.9% | 485 | 2.6% | 370 | 4.3% |
| Provincial Nominee** | 9,895 | 65.0% | 12,545 | 66.3% | 5,835 | 67.7% |
| Resettled Refugees & Protected Persons in Canada | 1,565 | 10.3% | 2,045 | 10.8% | 600 | 7.0% |
| Other*** | 50 | 0.3% | 50 | 0.3% | 35 | 0.4% |
| Total landings and percentage of Canada's total immigration | 15,225 | 4.7% | 18,910 | 5.5% | 8,620 | 4.7% |
| Difference from previous year | 520 | 3.5% | 3,685 | 24.2% | -10,290 | -54.4% |
*Includes permanent residents who landed in Manitoba through the Canadian Experience Class, Caregivers, Federal Skilled Trades, and Business streams.
**Provincial Nominees are nominated by the Manitoba Provincial Nominee Program (MPNP), and are a category of Economic Class immigrants.
***Includes permanent residents admitted to Manitoba through federal Humanitarian & Compassionate case streams, and all other permit holder classes not covered by the table.
Immigration by City
Winnipeg ranked seventh among Canadian cities as a destination for immigrants in 2020, following Toronto, Vancouver, Montreal, Calgary, Edmonton, and Ottawa. This is down one rank from the previous two years, in which Winnipeg ranked sixth above Ottawa. Together, the ten cities in Table 6 attracted close to 79% of new permanent residents to Canada in 2020.
Table 6: Canada - Admissions of Permanent Resident by Top Ten (Total 2018–2020 Rank) Census Metropolitan Area (CMA) of Intended Destination, 2018–2020
| Census Metropolitan Area | 2018 | 2019 | 2020 | 2018–2020 | ||||||
|---|---|---|---|---|---|---|---|---|---|---|
| Number | Percentage | Rank | Number | Percentage | Rank | Number | Percentage | Rank | Number | |
| Toronto | 106,460 | 33.2% | 1 | 117,770 | 34.5% | 1 | 60,975 | 33.1% | 1 | 285,205 |
| Montréal | 43,795 | 13.6% | 2 | 34,630 | 10.2% | 3 | 20,950 | 11.4% | 3 | 99,375 |
| Vancouver | 35,265 | 11.0% | 3 | 39,950 | 11.7% | 2 | 22,725 | 12.3% | 2 | 97,940 |
| Calgary | 18,950 | 5.9% | 4 | 19,625 | 5.8% | 4 | 10,650 | 5.8% | 4 | 49,225 |
| Edmonton | 15,730 | 4.9% | 5 | 16,420 | 4.8% | 5 | 8,345 | 4.5% | 5 | 40,495 |
| Winnipeg | 12,120 | 3.8% | 6 | 14,740 | 4.3% | 6 | 6,450 | 3.5% | 7 | 33,310 |
| Ottawa - Gatineau (Ontario Part) | 9,830 | 3.1% | 7 | 10,935 | 3.2% | 7 | 6,805 | 3.7% | 6 | 27,570 |
| Regina | 6,035 | 1.9% | 8 | 6,140 | 1.8% | 9 | 2,960 | 1.6% | 9 | 15,140 |
| Saskatoon | 5,800 | 1.8% | 9 | 5,865 | 1.7% | 10 | 2,805 | 1.5% | 10 | 14,470 |
| Halifax | 5,005 | 1.6% | 10 | 6,240 | 1.8% | 8 | 2,805 | 1.5% | – – | 14,050 |
| Total Top Ten | 258,990 | 80.7% | 272,320 | 79.8% | 145,470 | 78.9% | 676,785 | |||
| Other | 62,065 | 19.3% | 68,855 | 20.2% | 38,900 | 21.1% | 169,820 | |||
| Total | 321,055 | 100.0% | 341,175 | 100.0% | 184,370 | 100.0% | 846,605 | |||
3. Manitoba Permanent Residents
Sponsored Family
Eligible Canadian citizens and permanent residents living in Canada can sponsor their family members; spouses and dependents; and grandparents to come to Canada. In 2020, there were 1,490 permanent residents (17.3% of all admissions) who declared Manitoba as their intended destination through the Sponsored Family category, a decrease from 3,160 in 2019. The top source countries, accounting for 56.7% of permanent resident admissions in this category, included India (330), Philippines (320), China (105), and the United States (90) in 2020.
Table 7: Manitoba (Province of Intended Destination) - Admissions of Permanent Residents by Immigration Category, 2018–2020
| Immigration Category | 2018 | 2019 | 2020 | |||
|---|---|---|---|---|---|---|
| Sponsored Family | Number | Percentage | Number | Percentage | Number | Percentage |
| Principal Applicant (PA) | 2,295 | 15.1% | 2,610 | 13.8% | 1,220 | 14.2% |
| Spouse/Partner/Dependent (SD) | 450 | 3.0% | 555 | 2.9% | 270 | 3.1% |
| Sponsored Family Subtotal | 2,745 | 18.0% | 3,160 | 16.7% | 1,490 | 17.3% |
| Economic Class | ||||||
| Business | 15 | 0.1% | 20 | 0.1% | 15 | 0.2% |
| Canadian Experience Class - PA | 270 | 1.8% | 280 | 1.5% | 235 | 2.7% |
| Canadian Experience Class - SD | 100 | 0.7% | 135 | 0.7% | 110 | 1.3% |
| Caregiver Class - PA | 20 | 0.1% | 20 | 0.1% | – – | – – |
| Caregiver Class - SD | 30 | 0.2% | 30 | 0.2% | – – | – – |
| Provincial Nominees - PA | 4,195 | 27.6% | 5,890 | 31.1% | 2,870 | 33.3% |
| Provincial Nominees - SD | 5,695 | 37.4% | 6,650 | 35.2% | 2,965 | 34.4% |
| Skilled Trades | 0 | 0.0% | – – | – – | 5 | 0.1% |
| Skilled Workers - PA | 255 | 1.7% | 285 | 1.5% | 170 | 2.0% |
| Skilled Workers - SD | 285 | 1.9% | 335 | 1.8% | 125 | 1.5% |
| Economic Class Subtotal | 10,870 | 71.4% | 13,650 | 72.2% | 6,500 | 75.4% |
| Resettled Refugees & Protected Persons in Canada | ||||||
| Government-Assisted Refugees | 445 | 2.9% | 550 | 2.9% | 165 | 1.9% |
| Privately Sponsored Refugees | 935 | 6.1% | 1,105 | 5.8% | 185 | 2.1% |
| Blended Sponsorship Refugees | 70 | 0.5% | 155 | 0.8% | – – | – – |
| Protected Persons in Canada & Dependants | 120 | 0.8% | 235 | 1.2% | 250 | 2.9% |
| Resettled Refugees & Protected Persons in Canada Subtotal | 1,565 | 10.3% | 2,045 | 10.8% | 600 | 7.0% |
| Other | 50 | 0.3% | 50 | 0.3% | 35 | 0.4% |
| Total | 15,225 | 100.0% | 18,910 | 100.0% | 8,620 | 100.0% |
Refugees
In 2020, refugees from all over the world settled in communities throughout Manitoba, supported by various groups and service provider organizations. Of all permanent residents admitted to Manitoba in 2020, 7.0% were admitted as refugees and protected persons (600). Manitoba was the intended destination of 2.4% of all refugees and protected persons to Canada in 2020, down from 4.2% in 2019 (2,045). However, Manitoba accounted for 4.3% of Canada’s government-assisted refugee admissions (165) and 3.5% of privately sponsored refugee admissions (185) in 2020. These numbers still constitute decreases from 2019, when 5.5% of Canada’s government-assisted refugee admissions (550) and 5.7% of privately sponsored refugees (1,105) declared Manitoba as their intended destination.
Of all resettled refugees (excludes protected persons) who came to Manitoba from 2018–2020, the top countries of citizenship are Eritrea, Syria, Somalia, Democratic Republic of Congo, and Ethiopia.
Table 8: Manitoba (Province of Intended Destination) - Admissions of Resettled Refugees by Country of Citizenship, 2018–2020
| Country of Citizenship | Number | Percentage |
|---|---|---|
| Eritrea | 1,045 | 28.9% |
| Syria | 645 | 17.9% |
| Democratic Republic of Somalia | 630 | 17.5% |
| Democratic Republic of the Congo | 285 | 7.9% |
| Ethiopia | 225 | 6.2% |
| Iraq | 215 | 6.0% |
| Democratic Republic of Sudan | 85 | 2.4% |
| Central African Republic | 85 | 2.4% |
| Afghanistan | 60 | 1.7% |
| Iran | 55 | 1.5% |
| Burundi | 50 | 1.4% |
| Pakistan | 40 | 1.1% |
| Republic of South Sudan | 35 | 1.0% |
| All other countries | 150 | 4.2% |
| Total | 3,610 | 100.0% |
4. Destination
Regional Destination (Economic Region)
Immigration continues to benefit regional communities. Since 2018, approximately 33,010 immigrants declared the Winnipeg Economic Region to be their intended destination, while approximately 9,730 immigrants declared other economic regions outside of Winnipeg as their intended destinations. In 2020, 26.1% of newcomers had a destination outside of the Winnipeg Economic Region (2,245), an increase of just over 3.0% from 2019. All economic regions of the province outside of Winnipeg saw increases in the proportion of anticipated admissions compared to 2019.
Table 9: Manitoba (Province of Intended Destination) - Admissions of Permanent Residents by Economic Region of Intended Destination, 2018–2020
| Economic Region | 2018 | 2019 | 2020 | ||||||
|---|---|---|---|---|---|---|---|---|---|
| Number | Percentage | Rank | Number | Percentage | Rank | Number | Percentage | Rank | |
| Winnipeg | 12,030 | 79.0% | 1 | 14,610 | 77.3% | 1 | 6,370 | 73.9% | 1 |
| Southwest | 1,285 | 8.4% | 2 | 1,710 | 9.0% | 2 | 830 | 9.6% | 2 |
| South Central | 705 | 4.6% | 3 | 1,135 | 6.0% | 3 | 600 | 7.0% | 3 |
| Southeast | 500 | 3.3% | 4 | 535 | 2.8% | 4 | 265 | 3.1% | 4 |
| North | 310 | 2.0% | 5 | 305 | 1.6% | 5 | 190 | 2.2% | 5 |
| Interlake | 135 | 0.9% | 7 | 285 | 1.5% | 6 | 145 | 1.7% | 6 |
| Parklands | 155 | 1.0% | 6 | 175 | 0.9% | 7 | 90 | 1.0% | 8 |
| North Central | 105 | 0.7% | 8 | 150 | 0.8% | 8 | 125 | 1.5% | 7 |
| Not stated | – – | – – | 9 | 10 | 0.1% | 9 | – – | – – | 9 |
| Total | 15,225 | 100.0% | 18,910 | 100.0% | 8,620 | 100.0% | |||
Community Destination (Municipality)
Since 2018, approximately 32,955 immigrants declared Winnipeg as their intended destination compared to 9,800 who chose one of more than 130 regional communities in Manitoba. From 2018–2020, top regional destinations included Brandon (2,110), Neepawa (1,385), Morden (980), Winkler (745), and Thompson (620).
In 2020, 2,265 new permanent residents had regional communities outside of Winnipeg as their intended destinations, a 47.7% decrease from 2019 (4,330). This is consistent with the 54.4% year-on-year reduction in permanent resident admissions for all of Manitoba due to COVID-19 travel restrictions.
Table 10: Manitoba (Province of Intended Destination) - Admissions of Permanent Residents by Top Ten (2020 Rank) Municipality of Intended Destination, 2018–2020
| Municipality | 2018 | 2019 | 2020 | 2018–2020 | ||||||
|---|---|---|---|---|---|---|---|---|---|---|
| Number | Percentage | Rank | Number | Percentage | Rank | Number | Percentage | Rank | Number | |
| Winnipeg | 12,020 | 78.9% | 1 | 14,580 | 77.1% | 1 | 6,355 | 73.7% | 1 | 32,955 |
| Brandon | 705 | 4.6% | 2 | 875 | 4.6% | 2 | 530 | 6.1% | 2 | 2,110 |
| Neepawa | 430 | 2.8% | 3 | 700 | 3.7% | 3 | 250 | 2.9% | 3 | 1,385 |
| Morden | 250 | 1.6% | 4 | 515 | 2.7% | 4 | 215 | 2.5% | 4 | 980 |
| Winkler | 210 | 1.4% | 7 | 325 | 1.7% | 5 | 210 | 2.4% | 5 | 745 |
| Thompson | 230 | 1.5% | 5 | 245 | 1.3% | 7 | 145 | 1.7% | 6 | 620 |
| Steinbach | 225 | 1.5% | 6 | 270 | 1.4% | 6 | 125 | 1.5% | 7 | 615 |
| Portage la Prairie | 80 | 0.5% | 9 | 110 | 0.6% | 9 | 75 | 0.9% | 8 | 260 |
| Altona | 80 | 0.5% | 8 | 90 | 0.5% | 10 | 60 | 0.7% | 9 | 235 |
| Selkirk | 20 | 0.1% | — | 120 | 0.6% | 8 | 45 | 0.5% | 10 | 185 |
| Total Top Ten (2020 Rank) | 14,250 | 93.6% | 17,830 | 94.3% | 8,015 | 93.0% | 40,090 | |||
| Other municipalities in Manitoba | 975 | 6.4% | 1,080 | 5.7% | 610 | 7.1% | 2,665 | |||
| Total | 15,225 | 100.0% | 18,910 | 100.0% | 8,620 | 100.0% | 42,755 | |||
5. Source Country
In 2020, India, China, Philippines, Nigeria and Brazil ranked among the top five source countries for immigrants to Manitoba, representing 58.1% of all immigrants.
The top immigrant source countries to regional communities in 2020 were India (620), Philippines (555), Nigeria (140), Germany (135), and Pakistan (100).
Table 11: Manitoba (Province of Intended Destination) - Admissions of Permanent Residents by Top Ten (2020 Rank) Country of Citizenship, 2018–2020
| Country of Citizenship | 2018 | 2019 | 2020 | ||||||
|---|---|---|---|---|---|---|---|---|---|
| Number | Percentage | Rank | Number | Percentage | Rank | Number | Percentage | Rank | |
| India | 3,765 | 24.7% | 1 | 4,625 | 24.5% | 1 | 2,030 | 23.5% | 1 |
| China, People's Republic of | 1,300 | 8.5% | 4 | 1,810 | 9.6% | 3 | 1,050 | 12.2% | 2 |
| Philippines | 2,370 | 15.6% | 2 | 2,585 | 13.7% | 2 | 1,000 | 11.6% | 3 |
| Nigeria | 1,475 | 9.7% | 3 | 1,625 | 8.6% | 4 | 580 | 6.7% | 4 |
| Brazil | 225 | 1.5% | — | 585 | 3.1% | 6 | 350 | 4.1% | 5 |
| Pakistan | 325 | 2.1% | 7 | 445 | 2.4% | 7 | 245 | 2.8% | 6 |
| Algeria | 40 | 0.3% | — | 185 | 1.0% | — | 210 | 2.4% | 7 |
| Ukraine | 330 | 2.2% | 6 | 370 | 2.0% | 10 | 200 | 2.3% | 8 |
| Israel | 320 | 2.1% | 9 | 295 | 1.6% | — | 190 | 2.2% | 9 |
| Eritrea | 480 | 3.2% | 5 | 635 | 3.4% | 5 | 175 | 2.0% | 10 |
| Total Top Ten (2020 Rank) | 10,635 | 69.9% | 13,160 | 69.6% | 6,030 | 70.0% | |||
| Other Countries | 4,590 | 30.1% | 5,750 | 30.4% | 2,590 | 30.0% | |||
| Total | 15,225 | 100.0% | 18,910 | 100.0% | 8,620 | 100.0% | |||
World Region
In 2020, 56.4% of Manitoba’s new permanent residents were to have arrived from the Asia & Pacific region, followed by Africa and the Middle East (24.1%), The Americas [not including the United States] (8.9%), Europe (8.8%), and the United States (1.7%).
Table 12: Manitoba (Province of Intended Destination) - Admissions of Permanent Residents by World Area of Country of Citizenship, 2018–2020
| World Region | 2018 | 2019 | 2020 |
|---|---|---|---|
| Asia & Pacific | 8,700 | 10,620 | 4,860 |
| Africa & Middle East | 4,300 | 5,170 | 2,080 |
| Europe | 1,185 | 1,445 | 760 |
| Americas | 760 | 1,315 | 765 |
| United States of America | 275 | 320 | 145 |
| Stateless | 5 | 40 | 15 |
| Total | 15,225 | 18,910 | 8,620 |
6. Demographics
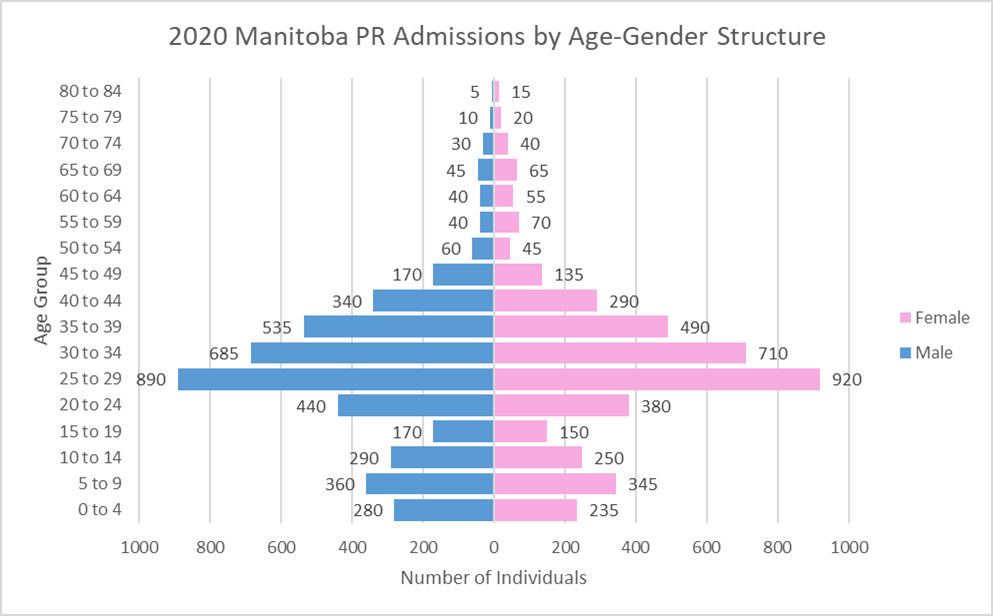
Age-Gender Structure
Newcomers are important contributors to Manitoba’s population growth and to the expanding labour force. In 2020, the median age of immigrants to Manitoba was 37.8 years[2] while the median age of Manitobans (general population) was 37.6 years in July 2020 (Statistics Canada, 2021).[3] Male and female numbers were roughly equal.
7. Official Languages
Mother Tongue
People arrive from all over the world with the ability to communicate in many languages other than just English or French. In 2020, permanent residents with Manitoba as their intended destination declared an ability to communicate in over 140 languages. The top languages spoken are Punjabi (14.0%), Chinese (13.1%), Tagalog (10.0%), Arabic (6.6%), and English (5.4%).
Table 13: Manitoba (Province of Intended Destination) - Admissions of Permanent Residents by Top Ten (2020 Rank) Language Spoken, 2018–2020
| Language Spoken | 2018 | 2019 | 2020 | ||||||
|---|---|---|---|---|---|---|---|---|---|
| Number | Percentage | Rank | Number | Percentage | Rank | Number | Percentage | Rank | |
| Punjabi | 2,640 | 17.3% | 1 | 3,095 | 16.4% | 1 | 1,210 | 14.0% | 1 |
| Chinese | 1,425 | 9.4% | 3 | 1,910 | 10.1% | 3 | 1,130 | 13.1% | 2 |
| Tagalog | 1,960 | 12.9% | 2 | 2,120 | 11.2% | 2 | 865 | 10.0% | 3 |
| Arabic | 665 | 4.4% | 6 | 935 | 4.9% | 5 | 565 | 6.6% | 4 |
| English | 895 | 5.9% | 4 | 1,055 | 5.6% | 4 | 465 | 5.4% | 5 |
| Gujarati | 570 | 3.7% | 7 | 715 | 3.8% | 7 | 445 | 5.2% | 6 |
| Portuguese | 250 | 1.6% | — | 605 | 3.2% | 8 | 360 | 4.2% | 7 |
| Russian | 515 | 3.4% | 8 | 525 | 2.8% | 10 | 315 | 3.7% | 8 |
| Yoruba | 845 | 5.6% | 5 | 920 | 4.9% | 6 | 285 | 3.3% | 9 |
| Spanish | 280 | 1.8% | — | 355 | 1.9% | — | 260 | 3.0% | 10 |
| Total Top Ten (2020 Rank) | 10,040 | 65.9% | 12,235 | 64.7% | 5,905 | 68.5% | |||
| Other Languages | 5,185 | 34.1% | 6,675 | 35.3% | 2,715 | 31.5% | |||
| Total | 15,225 | 100.0% | 18,910 | 100.0% | 8,620 | 100.0% | |||
English and French Official Languages Spoken
In 2020, the percentage of Manitoba’s immigrants who identified English as an official language spoken was 80.0%.
In 2020, Manitoba was the intended destination of 530 immigrants who declared French or Both French and English as their official languages, representing 6.1% of all immigrants to Manitoba. By comparison, Manitoba was the intended destination of 820 immigrants who declared French or Both French and English as their official languages in 2019, which accounted for 4.3% of all permanent residents admitted that year. The percentage of immigrants with French or Both French and English as their official languages and Manitoba as an intended destination grew from 2.5% in 2018 to 6.1% in 2020. Overall, 1,745 immigrants with Manitoba as their intended destination declared an ability to communicate in French from 2018–2020. This represents 4.1% of all permanent resident admissions to Manitoba during the most recent three-year period.
In 2020, the top source countries for immigrants who identified either French, or Both French and English, as their official language(s) were Algeria (175), Morocco (60), Tunisia (40), France (30), and Djibouti (25). In 2019, the top source countries were Algeria (150), Democratic Republic of Congo (125), Morocco (75), France (65), and Tunisia (60).
In 2020, 2.2% of all MPNP nominations were French-speaking, down from 3.9% in 2019. Nearly 71 per cent of all immigrants with Manitoba as their intended destination who declared either French or Both French and English as their official languages were Provincial Nominees in 2020, up from 65.9% in 2019.
Table 14: Manitoba (Province of Intended Destination) - Admissions of Permanent Residents by Official Language Spoken, 2018–2020
| Official Language | 2018 | 2019 | 2020 |
|---|---|---|---|
| English | 11,795 | 14,950 | 6,900 |
| French | 110 | 300 | 195 |
| Both French and English | 285 | 520 | 335 |
| Neither | 2,570 | 2,850 | 1,105 |
| Not stated | 465 | 290 | 85 |
| Total | 15,225 | 18,910 | 8,620 |
8. Education, Occupation, and Skill Level
A key component of Manitoba’s Skills, Talent and Knowledge Strategy is increasing alignment of post-secondary and immigration systems to labour market need. In 2020, four of the top five assessed occupations among highly skilled economic immigrants to Manitoba were considered high-demand occupations in the Manitoba Labour Market Outlook Report 2021–2025[4] (food service supervisors being the one exception).
In 2020, approximately 47.9% of permanent residents admitted to Manitoba aged 25 and older had a bachelor’s degree or higher, compared to 51.1% in 2019.
Table 15: Manitoba (Province of Intended Destination) - Admissions of Permanent Residents Aged 25 Years and Over by Education Qualification, 2018–2020
| Level of Education | 2018 | 2019 | 2020 | |||
|---|---|---|---|---|---|---|
| None | 140 | 1.4% | 160 | 1.3% | 50 | 0.9% |
| Secondary or Less | 1,495 | 15.1% | 1,785 | 14.7% | 705 | 12.3% |
| Trade Diploma or Certificate | 660 | 6.7% | 710 | 5.9% | 360 | 6.3% |
| Non-University Certificate or Diploma | 700 | 7.1% | 790 | 6.5% | 375 | 6.6% |
| Post-Secondary - No Degree | 555 | 5.6% | 685 | 5.7% | 375 | 6.6% |
| Bachelor's Degree | 3,590 | 36.3% | 4,145 | 34.2% | 1,850 | 32.4% |
| Post-Graduate - No Degree | 205 | 2.1% | 385 | 3.2% | 195 | 3.4% |
| Master's Degree | 1,450 | 14.7% | 1,570 | 13.0% | 640 | 11.2% |
| Doctorate - PhD | 95 | 1.0% | 95 | 0.8% | 55 | 1.0% |
| Not stated | 995 | 10.1% | 1,785 | 14.7% | 1,110 | 19.4% |
| Total | 9,890 | 100.0% | 12,115 | 100.0% | 5,715 | 100.0% |
Occupation
Based on the NOC system, in 2020, 66.3% of principal applicants under the economic category were considered highly skilled (NOC 0, A and B); up from 64.3% in 2019. Skilled and Technical professions and Intermediate and Clerical positions were the top occupations of economic immigrants (principal applicants only) to Manitoba in 2020. The leading NOC 0, A, B occupations among immigrants to Manitoba in 2020 were:
- Cooks [Skill B] (205)
- Food service supervisors [Skill B] (115)
- Administrative assistants [Skill B] (115)
- Computer programmers and interactive media developers [Skill A] (70)
- Administrative officers [Skill B] (65)
By comparison, the most numerous, highly skilled NOCs amongst immigrants in 2019 were Cooks (285), Food service supervisors (160), Administrative assistants (145), Early childhood educators and assistants (105), and Administrative officers (105).
The five most common occupations across all skill levels (NOC 0, A, B, C, D) among permanent residents with Manitoba as an intended destination (based on principal applicants only) in 2020 were as follows:
- Cooks [Skill B] (205)
- Food counter attendants, kitchen helpers and related occupations [Skill D] (175)
- Transport truck drivers [Skill C] (130)
- Other customer and information services representatives [Skill C] (120)
- Food service supervisors [Skill B] (115)
By comparison, the top 5 assessed occupations in 2019 were food counter attendants, kitchen helpers and related support occupations (335); cooks (285); transport truck drivers (265); industrial butchers and meat cutters, poultry preparers and related workers (255); and other customer and information services representatives (230).
Table 16: Manitoba (Province of Intended Destination) - Admissions of Economic Permanent Residents (Principal Applicant Only) by Skill Level, 2020
| Skill Level | Number | Percentage |
|---|---|---|
| 0 - Managerial | 285 | 8.7% |
| A - Professionals | 595 | 18.1% |
| B - Skilled and Technical | 1,295 | 39.5% |
| C - Intermediate and Clerical | 760 | 23.2% |
| D - Elemental and Labourers | 315 | 9.6% |
| Intending to work* | 10 | 0.3% |
| Not intending to work* | – – | – – |
| Not stated | 15 | 0.5% |
| Total | 3,280 | 100.0% |
The table represents skill level for Economic Immigrant Principal Applicants only, including Provincial Nominees, federally selected skilled workers, businesspersons, live-in caregivers, and Canadian Experience Class.
*Intending to work includes new workers (15 years of age or older); not intending to work includes other non-workers (15 years of age or older) and students (15 years of age or older). Rank is based on the highest number of permanent resident admissions by occupation for economic principal applicants only in 2019 and 2020.
Skill Type Category
Sales and service professions accounted for nearly one third of the assessed occupations of Manitoba Economic Class Permanent Residents in 2020 (31.7%), a figure comparable to 2019 (31.0%), and nearly 10 percentage points higher than what was observed in 2018 (22.1%). Professions in sales and services; business, finance and administration; natural and applied sciences; and trades, transport and equipment operation accounted for 72.3% of assessed occupations in 2020. This marks an increase from 2019 (67.3%) and 2018 (61.1%).
Table 17: Manitoba (Province of Intended Destination) - Admissions of Economic Permanent Residents (Principal Applicant Only) by Intended Occupation (1-Digit NOC 2011), 2018–2020
| Occupations | 2018 | 2019 | 2020 | |||
|---|---|---|---|---|---|---|
| Number | Percentage | Number | Percentage | Number | Percentage | |
| 0 - Management occupations | 460 | 9.7% | 575 | 8.9% | 250 | 7.6% |
| 1 - Business, finance and administration occupations | 765 | 16.1% | 970 | 15.0% | 515 | 15.7% |
| 2 - Natural and applied sciences and related occupations | 650 | 13.7% | 755 | 11.6% | 480 | 14.6% |
| 3 - Health occupations | 310 | 6.5% | 230 | 3.5% | 100 | 3.0% |
| 4 - Occupations in education, law and social, community and government services | 430 | 9.1% | 410 | 6.3% | 215 | 6.6% |
| 5 - Occupations in art, culture, recreation and sport | 50 | 1.1% | 75 | 1.2% | 30 | 0.9% |
| 6 - Sales and service occupations | 1,050 | 22.1% | 2,010 | 31.0% | 1,040 | 31.7% |
| 7 - Trades, transport and equipment operators and related occupations | 435 | 9.2% | 630 | 9.7% | 335 | 10.2% |
| 8 - Natural resources, agriculture and related production occupations | 75 | 1.6% | 85 | 1.3% | 40 | 1.2% |
| 9 - Occupations in manufacturing and utilities | 255 | 5.4% | 505 | 7.8% | 210 | 6.4% |
| Not stated | – – | – – | 35 | 0.5% | 15 | 0.5% |
| Other* | 265 | 5.6% | 195 | 3.0% | 50 | 1.5% |
| Total | 4,750 | 100.0% | 6,485 | 100.0% | 3,280 | 100.0% |
The table represents skill level for Economic Immigrant Principal Applicants only, including Provincial Nominees, federally selected skilled workers, businesspersons, live-in caregivers, and Canadian Experience Class.
*Other category includes principal applicants not intending to work and other occupations not covered by a NOC code.
9. Temporary Foreign Workers and International Students
Temporary Residents
In Manitoba, temporary residents who have worked for more than six months on a full-time, continuous basis – or who have graduated from a post-secondary program in the province – have pathways to apply to the MPNP to become permanent residents. A total of 9,095 temporary foreign workers (TFWs) declared Manitoba as their intended destination through the federal International Mobility Program in 2020. This marks an increase of 1.2% from the previous year. There were also 940 TFWs who declared Manitoba as their intended destination through the Government of Canada’s Temporary Foreign Worker Program (with a Labour Market Impact Assessment). This marks a decline of 28.5% from 2019.
Table 18: Manitoba (Province of Destination) - Work Permit Holders by Program and Year in which Permit(s) Became Effective*, 2011–2020
| Program | 2011 | 2012 | 2013 | 2014 | 2015 | 2016 | 2017 | 2018 | 2019 | 2020 |
|---|---|---|---|---|---|---|---|---|---|---|
| Temporary Foreign Worker Program Work Permit Holders | 1,345 | 1,860 | 1,795 | 1,380 | 885 | 875 | 770 | 1,170 | 1,315 | 940 |
| International Mobility Program Work Permit Holders | 3,875 | 4,025 | 4,720 | 5,040 | 5,060 | 6,695 | 7,205 | 8,110 | 8,985 | 9,095 |
*This term refers to permit holders with a valid permit that was signed in the given calendar year. The total unique count may not equal the sum of permit holders in each program, as an individual may hold more than one type of permit over a given period.
Table 19: Manitoba (Province of Destination) - Temporary Foreign Worker Program (TFWP) Work Permit Holders with Labour Market Impact Assessment (LMIA) by Census Metropolitan Area of Destination and Year in which Permit(s) Became Effective*, 2011–2020
| Census Metropolitan Area | 2011 | 2012 | 2013 | 2014 | 2015 | 2016 | 2017 | 2018 | 2019 | 2020 |
|---|---|---|---|---|---|---|---|---|---|---|
| Brandon | 190 | 315 | 245 | 220 | 180 | 140 | 135 | 130 | 140 | – – |
| Winnipeg | 730 | 820 | 855 | 520 | 255 | 270 | 250 | 280 | 370 | 375 |
| Other | 430 | 730 | 700 | 645 | 455 | 465 | 380 | 760 | 800 | 560 |
| Total Unique TFWP Work Permit Holders | 1,345 | 1,860 | 1,795 | 1,380 | 885 | 875 | 770 | 1,170 | 1,315 | 940 |
*This term refers to permit holders with a valid permit that was signed in the given calendar year. The total unique count may not equal the sum of permit holders in each program, as an individual may hold more than one type of permit over a given period.
Table 20: Manitoba (Province of Destination) - International Mobility Program (IMP) Work Permit Holders by Census Metropolitan Area of Destination and Year in which Permit(s) Became Effective*, 2011–2020
| Census Metropolitan Area | 2011 | 2012 | 2013 | 2014 | 2015 | 2016 | 2017 | 2018 | 2019 | 2020 |
|---|---|---|---|---|---|---|---|---|---|---|
| Brandon | 230 | 170 | 195 | 265 | 195 | 185 | 245 | 245 | 295 | 340 |
| Winnipeg | 2,755 | 3,000 | 3,380 | 3,260 | 3,550 | 5,100 | 5,455 | 6,310 | 6,940 | 7,220 |
| Other | 895 | 860 | 1,185 | 1,565 | 1,340 | 1,440 | 1,545 | 1,580 | 1,775 | 1,560 |
| Total Unique IMP Work Permit Holders | 3,875 | 4,025 | 4,720 | 5,040 | 5,060 | 6,695 | 7,205 | 8,110 | 8,985 | 9,095 |
*This term refers to permit holders with a valid permit that was signed in the given calendar year. The total unique count may not equal the sum of permit holders in each program, as an individual may hold more than one type of permit over a given period.
International Students
In 2020, the number of international students declaring Manitoba as their intended destination was 8,400. This constitutes a 30.1% decrease from 2019 (12,020). Most international students (93.3%) were issued permits in connection with educational institutions in Winnipeg, a proportional increase from the previous year (91.7%). The top source countries of international students to Manitoba were China (22.6%), India (20.2%), Nigeria (11.1%), Bangladesh (7.6%), and Vietnam (4.8%). This is similar to what was observed in 2019, though China overtook India as the number one source country for international students to Manitoba in 2020.
Table 21: Manitoba (Province of Destination) - Study Permit Holders by Census Metropolitan Area of Destination and Year in which Permit(s) Became Effective*, 2011–2020
| Census Metropolitan Area | 2011 | 2012 | 2013 | 2014 | 2015 | 2016 | 2017 | 2018 | 2019 | 2020 |
|---|---|---|---|---|---|---|---|---|---|---|
| Brandon | 145 | 150 | 175 | 160 | 240 | 290 | 410 | 495 | 605 | 320 |
| Winnipeg | 3,980 | 4,450 | 5,235 | 5,650 | 6,365 | 7,955 | 9,660 | 11,155 | 11,020 | 7,840 |
| Other | 395 | 375 | 320 | 340 | 325 | 335 | 395 | 350 | 405 | 250 |
| Total Unique Study Permit Holders | 4,510 | 4,975 | 5,725 | 6,145 | 6,925 | 8,570 | 10,450 | 11,990 | 12,020 | 8,400 |
*This term refers to permit holders with a valid study permit that was signed and issued in each calendar year noted above. The total unique count may not equal the sum of permit holders in each program, as an individual may hold more than one type of permit over a given period.
Table 22: Manitoba (Province of Destination) - Study Permit Holders by Top Ten (2020 Rank) Country of Citizenship and Year in which Permit(s) Became Effective*, 2018–2020
| Country of Citizenship | 2018 | 2019 | 2020 | ||||||
|---|---|---|---|---|---|---|---|---|---|
| Number | Percentage | Rank | Number | Percentage | Rank | Number | Percentage | Rank | |
| China, People's Republic of | 2,745 | 22.9% | 2 | 2,565 | 21.3% | 2 | 1,895 | 22.6% | 1 |
| India | 2,935 | 24.5% | 1 | 2,990 | 24.9% | 1 | 1,695 | 20.2% | 2 |
| Nigeria | 960 | 8.0% | 3 | 1,155 | 9.6% | 3 | 935 | 11.1% | 3 |
| Bangladesh | 795 | 6.6% | 4 | 930 | 7.7% | 4 | 640 | 7.6% | 4 |
| Vietnam | 500 | 4.2% | 5 | 470 | 3.9% | 5 | 405 | 4.8% | 5 |
| Hong Kong SAR | 125 | 1.0% | — | 135 | 1.1% | — | 245 | 2.9% | 6 |
| Pakistan | 235 | 2.0% | 8 | 220 | 1.8% | 8 | 200 | 2.4% | 7 |
| Korea, Republic of | 340 | 2.8% | 7 | 305 | 2.5% | 7 | 185 | 2.2% | 8 |
| Brazil | 400 | 3.3% | 6 | 315 | 2.6% | 6 | 150 | 1.8% | 9 |
| Kenya | 165 | 1.4% | 10 | 155 | 1.3% | — | 135 | 1.6% | 10 |
| Total Top Ten (2020 Rank) | 9,205 | 76.8% | 9,240 | 76.9% | 6,490 | 77.3% | |||
| Other Countries of Citizenship | 2,785 | 23.2% | 2,780 | 23.1% | 1,910 | 22.7% | |||
| Total Unique Study Permit Holders | 11,990 | 100.0% | 12,020 | 100.0% | 8,400 | 100.0% | |||
*This term refers to permit holders with a valid study permit that was signed and issued in each year noted above. Rank is based on the highest number of study permits by country of citizenship.
The majority of international students in Manitoba who were in possession of a study permit at the end of 2020 received permits in connection with educational institutions in Winnipeg (93.3%); a proportional increase from 2019 (92.4%). The top source countries of international students to Manitoba (based on valid study permit holders at year end) were India (26.3%), China (18.6%), Nigeria (10.5%), Bangladesh (7.2%), and Vietnam (4.8%). This is comparable to what was observed in 2019.
Table 23: Manitoba (Province of Destination) - Study Permit Holders on December 31st by Census Metropolitan Area of Destination*, 2011–2020
| Census Metropolitan Area | 2011 | 2012 | 2013 | 2014 | 2015 | 2016 | 2017 | 2018 | 2019 | 2020 |
|---|---|---|---|---|---|---|---|---|---|---|
| Brandon | 195 | 245 | 285 | 295 | 355 | 450 | 585 | 715 | 925 | 735 |
| Winnipeg | 5,800 | 7,190 | 8,685 | 10,010 | 11,055 | 12,840 | 15,285 | 17,400 | 17,835 | 15,575 |
| Other | 485 | 520 | 500 | 515 | 480 | 480 | 560 | 525 | 540 | 385 |
| Total Unique Study Permit Holders | 6,480 | 7,955 | 9,470 | 10,815 | 11,895 | 13,770 | 16,425 | 18,635 | 19,300 | 16,695 |
*Defined by the intended destination as specified on the permit. When the intended destination is not specified, the last known address of the permit holder is used, as of December 31st of the given year.
Table 24: Manitoba (Province of Destination) - Study Permit Holders on December 31st by Top Ten (2020 Rank) Country of Citizenship, 2018–2020
| Country of Citizenship | 2018 | 2019 | 2020 | ||||||
|---|---|---|---|---|---|---|---|---|---|
| Number | Percentage | Rank | Number | Percentage | Rank | Number | Percentage | Rank | |
| India | 4,085 | 21.9% | 2 | 5,035 | 26.1% | 1 | 4,395 | 26.3% | 1 |
| People's Republic of China | 4,235 | 22.7% | 1 | 3,765 | 19.5% | 2 | 3,110 | 18.6% | 2 |
| Nigeria | 1,810 | 9.7% | 3 | 1,855 | 9.6% | 3 | 1,750 | 10.5% | 3 |
| Bangladesh | 1,045 | 5.6% | 4 | 1,305 | 6.8% | 4 | 1,205 | 7.2% | 4 |
| Vietnam | 890 | 4.8% | 5 | 925 | 4.8% | 5 | 805 | 4.8% | 5 |
| Pakistan | 450 | 2.4% | 8 | 390 | 2.0% | 8 | 355 | 2.1% | 6 |
| Republic of Korea | 525 | 2.8% | 7 | 465 | 2.4% | 7 | 340 | 2.0% | 7 |
| United States of America | 375 | 2.0% | 9 | 375 | 1.9% | 9 | 330 | 2.0% | 8 |
| Hong Kong SAR | 210 | 1.1% | — | 205 | 1.1% | — | 325 | 1.9% | 9 |
| Brazil | 605 | 3.2% | 6 | 475 | 2.5% | 6 | 295 | 1.8% | 10 |
| Total Top Ten (2020 Rank) | 14,235 | 76.4% | 14,790 | 76.6% | 12,905 | 77.3% | |||
| Other Countries of Citizenship | 4,400 | 23.6% | 4,510 | 23.4% | 3,790 | 22.7% | |||
| Total Unique Study Permit Holders | 18,635 | 100.0% | 19,300 | 100.0% | 16,695 | 100.0% | |||
Footnotes
[1] Statistics Canada. Population estimates, quarterly. www150.statcan.gc.ca/t1/tbl1/en/tv.action?pid=1710000901. Accessed October 28, 2021.
[2] Statistics Canada, (Manitoba). 2016 Census Data tables – Admission Category and Applicant Type (47), Immigrant Status and Period of Immigration (11B), Age (7A), Sex (3) and Selected Demographic, Cultural, Labour Force and Educational Characteristics (825) for the Population in Private Households of Canada, Provinces and Territories and Census Metropolitan Areas, 2016 Census – 25% Sample Data (statcan.gc.ca) (Accessed October 22, 2021).
[3] Statistics Canada Demographic Estimates Program, Table 17-10-0005-01, released September 29, 2021.
[4] Manitoba Economic Development and Jobs. The Manitoba Labour Market Outlook Report 2021–2025. Manitoba Labour Market Outlook. Accessed October 29, 2021.