Introduction
Manitoba continues to be an immigration destination of choice to live, work, study, and invest for thousands of newcomers year after year. The diversity in culture, language, education, and lived experiences are among the many features that immigrants share and which continues to enrich communities throughout the province.
Note: Data in this report was created by the Province of Manitoba using IRCC Q2 2019 immigration data and has been approved by IRCC for public release. Please note that all values between 0 and 5 are shown as “– –”. This is done to prevent individuals from being identified when IRCC data is compiled and compared to other publicly available statistics. All other values are rounded to the closes multiple of 5 for the same reason; as a result of rounding, data may not sum to the totals indicated. Data are preliminary and subject to change.
1. Immigration Trends
By July 1, 2018, Manitoba was estimated to have more than 1.35 million people, an increase of 1.25% over 2017 representing about 3.4% of Canada’s total population of approximately 37.0 million. In 2018, 15,230 permanent residents chose Manitoba as their immigration destination. This represents 4.7% of total immigration to Canada.
Table 1: Permanent Immigration to Manitoba in the Past Decade
| Category | 2009 | 2010 | 2011 | 2012 | 2013 | 2014 | 2015 | 2016 | 2017 | 2018 | Total |
|---|---|---|---|---|---|---|---|---|---|---|---|
| Sponsored Family | 1,470 | 1,450 | 1,490 | 1,800 | 2,000 | 1,845 | 1,850 | 2,375 | 2,475 | 2,745 | 19,500 |
| Skilled Workers | 600 | 905 | 620 | 660 | 620 | 395 | 715 | 490 | 295 | 540 | 5,840 |
| Provincial Nominee | 10,155 | 12,180 | 12,355 | 9,540 | 8,870 | 12,195 | 10,260 | 9,960 | 9,430 | 9,895 | 104,840 |
| Other Economic | 155 | 200 | 190 | 145 | 130 | 270 | 270 | 240 | 330 | 435 | 2,365 |
| Refugee | 1,100 | 1,030 | 1,305 | 1,145 | 1,475 | 1,515 | 1,765 | 3,735 | 2,135 | 1,565 | 16,770 |
| Other | 50 | 50 | 20 | 45 | 50 | 30 | 35 | 25 | 35 | 50 | 390 |
| Total | 13,525 | 15,815 | 15,975 | 13,340 | 13,140 | 16,255 | 14,900 | 16,825 | 14,705 | 15,230 | 149,710 |
In 2018, Canada welcomed 321,055 new permanent residents, an increase of 12.1% over 2017. By immigration category, the largest groups were, family class (26.5%), skilled workers (22.2%), Provincial Nominees (19.4%) and other economic immigrants (16.4%).
Table 2: Immigration to Canada in the Past Decade
| Category | 2009 | 2010 | 2011 | 2012 | 2013 | 2014 | 2015 | 2016 | 2017 | 2018 | Total |
|---|---|---|---|---|---|---|---|---|---|---|---|
| Sponsored Family | 71,980 | 65,550 | 61,330 | 69,870 | 83,375 | 67,645 | 65,485 | 78,000 | 82,470 | 85,170 | 730,875 |
| Skilled Workers | 95,985 | 119,380 | 88,760 | 91,415 | 83,225 | 67,575 | 70,135 | 65,610 | 47,415 | 71,235 | 800,735 |
| Provincial Nominee | 30,380 | 36,435 | 38,420 | 40,885 | 39,905 | 47,625 | 44,535 | 46,180 | 49,730 | 62,440 | 436,535 |
| Other Economic | 27,165 | 31,140 | 28,910 | 28,455 | 25,130 | 49,990 | 55,750 | 44,240 | 62,145 | 52,690 | 405,615 |
| Refugee | 22,835 | 24,670 | 27,880 | 23,085 | 24,005 | 23,460 | 31,615 | 58,550 | 41,120 | 45,495 | 322,715 |
| Other | 3,830 | 3,515 | 3,400 | 4,065 | 3,400 | 4,005 | 4,315 | 3,790 | 3,630 | 4,025 | 37,975 |
| Total | 252,170 | 280,695 | 248,705 | 257,775 | 259,040 | 260,305 | 271,835 | 296,370 | 286,510 | 321,055 | 2,734,460 |
2. Immigration Levels
Immigration to Canada increased 12.1% from 286,510 in 2017 to 321,055 in 2018.
Table 3: Canada Permanent Residents by Immigration Category
| Immigration Category | 2016 | 2017 | 2018 | |||
|---|---|---|---|---|---|---|
| Sponsored Family | 78,000 | 26.3% | 82,470 | 28.8% | 85,170 | 26.5% |
| Skilled Workers | 65,610 | 22.1% | 47,415 | 16.5% | 71,235 | 22.2% |
| Other Economic | 46,180 | 15.6% | 49,730 | 17.4% | 62,440 | 19.4% |
| Provincial Nominee** | 44,240 | 14.9% | 62,145 | 21.7% | 52,690 | 16.4 |
| Refugee | 58,550 | 19.8% | 41,120 | 14.4% | 45,495 | 14.2% |
| Other* | 3,790 | 1.3% | 3,630 | 1.3% | 4,025 | 1.3% |
| Total | 296,370 | 100.0% | 286,510 | 100.0% | 321,055 | 100% |
| Difference from previous year | 24,535 | 9.0% | -9,860 | -3.3% | 34,545 | 12.1% |
**Provincial Nominees are a subcategory of the Economic Class.
Immigration by Province or Territory
In 2018, the top destinations for new permanent residents were Ontario, Quebec and British Columbia followed by Alberta and Manitoba. A number of provinces had a decrease in landings compared to the previous year including MB, SK, PEI, AB, QC.
Table 4: Permanent Residents by Province/Territory
| Province/Territory | 2016 | 2017 | 2018 | |||
|---|---|---|---|---|---|---|
| Newfoundland and Labrador | 1,190 | 0.4% | 1,170 | 0.4% | 1,530 | 0.5% |
| Prince Edward Island | 2,315 | 0.8% | 2,350 | 0.8% | 2,135 | 0.7% |
| Nova Scotia | 5,485 | 1.9% | 4,515 | 1.6% | 5,965 | 1.9% |
| New Brunswick | 4,675 | 1.6% | 3,650 | 1.3% | 4,610 | 1.4% |
| Quebec | 53,250 | 18.0% | 52,405 | 18.3% | 51,125 | 15.9% |
| Ontario | 110,020 | 37.1% | 111,955 | 39.1% | 137,435 | 42.8% |
| Manitoba | 16,825 | 5.7% | 14,705 | 5.1% | 15,230 | 4.7% |
| Saskatchewan | 14,860 | 5.0% | 14,680 | 5.1% | 15,510 | 4.8% |
| Alberta | 49,200 | 16.6% | 42,095 | 14.7% | 42,025 | 13.1% |
| British Columbia | 38,075 | 12.8% | 38,445 | 13.4% | 44,870 | 14.0% |
| Northwest Territories | 210 | 0.1% | 225 | 0.1% | 305 | 0.1% |
| Nunavut | 185 | 0.1% | 240 | 0.1% | 280 | 0.1% |
| Yukon | 35 | 0.0% | 40 | 0.0% | 30 | 0.0% |
| Not stated | 55 | 0.0% | 40 | 0.0% | 10 | 0.0% |
| Total | 296,370 | 100.0% | 286,510 | 100.0% | 321,055 | 100.0% |
Admissions in 2018 with Manitoba as an intended destination decreased to 4.7% compared to 5.1% in 2017. This decrease represents the lowest proportionate intake since 2013. Manitoba saw a slight increase in PN landings (65%) proportionate to all other immigrant categories over the previous year (54.1%) and a decrease in refugee landings to 10.3% from 14.5% in 2017.
Table 5: Summary of Manitoba Permanent Residents by Immigration Category
| Immigration Category | 2016 | 2017 | 2018 | |||
|---|---|---|---|---|---|---|
| Sponsored Family | 2,375 | 14.1% | 2,475 | 16.8% | 2,745 | 18.0% |
| Skilled Workers | 490 | 2.9% | 295 | 2.0% | 540 | 3.5% |
| Other Federal Economic | 9,960 | 59.2% | 9,430 | 64.1% | 9,895 | 65.0% |
| Provincial Nominee** | 240 | 1.4% | 330 | 2.2% | 435 | 2.9% |
| Refugee | 3,735 | 22.2% | 2,135 | 14.5% | 1,565 | 10.3% |
| Other* | 25 | 0.1% | 35 | 0.2% | 50 | 0.3% |
| Total | 16,825 | 5.7% | 14,705 | 5.1% | 15,230 | 4.7% |
| Difference from previous year | 1,925 | 12.9% | -2,120 | -12.6% | 525 | 3.6% |
*Includes Humanitarian and Compassionate, Permit Holders Class, Public Policy, and Family Relations.
**Provincial Nominees are a subcategory of the Economic Class.
Immigration by City
Similar to the previous three years, Winnipeg continued to rank 6th among Canadian cities as a destination for immigrants in 2018, following Toronto, Montreal, Vancouver, Calgary, and Edmonton. Together, these cities attracted 72.4% of new permanent residents.
Table 6: Summary of Canada Permanent Residents by Census Metropolitan Area (CMA)
| CMA | 2016 | 2017 | 2018 | ||||||
|---|---|---|---|---|---|---|---|---|---|
| Number | Percentage | Rank | Number | Percentage | Rank | Number | Percentage | Rank | |
| Toronto | 81,460 | 27.5% | 1 | 86,580 | 30.2% | 1 | 106,460 | 33.2% | 1 |
| Montréal | 44,350 | 15.0% | 2 | 44,725 | 15.6% | 2 | 43,795 | 13.6% | 2 |
| Vancouver | 29,715 | 10.0% | 3 | 29,830 | 10.4% | 3 | 35,265 | 11.0% | 3 |
| Calgary | 21,430 | 7.2% | 4 | 17,880 | 6.2% | 4 | 18,955 | 5.9% | 4 |
| Edmonton | 17,885 | 6.0% | 5 | 15,920 | 5.6% | 5 | 15,735 | 4.9% | 5 |
| Winnipeg | 14,070 | 4.7% | 6 | 11,845 | 4.1% | 6 | 12,120 | 3.8% | 6 |
| Ottawa – Gatineau | 7,870 | 2.7% | 7 | 7,470 | 2.6% | 7 | 9,830 | 3.1% | 7 |
| Regina | 4,995 | 1.7% | 9 | 5,295 | 1.8% | 9 | 6,035 | 1.9% | 8 |
| Saskatoon | 5,750 | 1.9% | 8 | 5,955 | 2.1% | 8 | 5,800 | 1.8% | 9 |
| Halifax | 4,570 | 1.5% | 10 | 3,745 | 1.3% | 10 | 5,005 | 1.6% | 10 |
| Total Top Ten | 232,095 | 78.3% | 229,245 | 80.0% | 259,000 | 80.7% | |||
| Other | 64,275 | 21.7% | 57,265 | 20.0% | 62,055 | 19.3% | |||
| Total | 296,370 | 100.0% | 286,510 | 100.0% | 321,055 | 100.0% | |||
3. Manitoba Permanent Residents
Between 2009 and 2018, more than 149,700 immigrants settled in Manitoba.
Table 7: Manitoba Permanent Residents by Immigration Category
| Immigration Category | 2016 | 2017 | 2018 | |||
|---|---|---|---|---|---|---|
| Sponsored Family | Number | Percentage | Number | Percentage | Number | Percentage |
| Principal Applicant | 1,960 | 11.6% | 2,060 | 14.0% | 2,295 | 15.1% |
| Spouse/Partner/Dependant | 415 | 2.5% | 420 | 2.9% | 450 | 3.0% |
| Sponsored Family Subtotal | 2,375 | 14.1% | 2,475 | 16.8% | 2,745 | 18.0% |
| Economic Class | ||||||
| Business | 10 | 0.1% | — | — | 15 | 0.0% |
| Canadian Experience Class – PA | 60 | 0.4% | 160 | 1.1% | 270 | 1.8% |
| Canadian Experience Class – SD | 60 | 0.4% | 75 | 0.5% | 100 | 0.7% |
| Caregiver Class – PA | 45 | 0.3% | 20 | 0.1% | 20 | 0.1% |
| Caregiver Class – SD | 50 | 0.3% | 55 | 0.4% | 30 | 0.2% |
| Provincial/Territorial Nominees – PA | 4,110 | 24.4% | 3,900 | 26.5% | 4,195 | 27.5% |
| Provincial/Territorial Nominees – SD | 5,845 | 34.7% | 5,530 | 37.6% | 5,695 | 37.4% |
| Skilled Trades | 20 | 0.0% | 20 | 0.1% | 0 | 0.0% |
| Skilled Workers – PA | 310 | 1.8% | 330 | 2.2% | 550 | 3.6% |
| Skilled Workers – SD | 410 | 2.4% | 300 | 2.0% | 415 | 2.7% |
| Economic Class Subtotal | 10,690 | 63.5% | 10,060 | 68.4% | 10,870 | 71.4% |
| Refugees | ||||||
| Government-Assisted Refugees | 1,270 | 7.5% | 605 | 4.1% | 445 | 2.9% |
| Privately Sponsored Refugees | 2,075 | 12.3% | 1,365 | 9.3% | 935 | 6.1% |
| Blended Sponsorship Refugees | 320 | 1.9% | 90 | 0.6% | 70 | 0.5% |
| Protected Persons in Canada & Dependents | 70 | 0.4% | 80 | 0.5% | 120 | 0.8% |
| Refugee Subtotal | 3,735 | 22.2% | 2,135 | 14.5% | 1,565 | 10.3% |
| Other Immigrants | 25 | 0.1% | 35 | 0.2% | 50 | 0.3% |
| Total | 16,825 | 100.0% | 14,705 | 100.0% | 15,230 | 100.0% |
The Manitoba Provincial Nominee Program (MPNP) continues to be the main tool for bringing skilled economic immigrants to meet Manitoba’s labour and economic development needs. On an annual basis the MPNP nominates skilled workers, international students, and business investors who are best suited to contribute to Manitoba’s economy.
Between 2009 and 2018, the MPNP landings contributed 65% of all immigrants to Manitoba, and approximately 92.7% of all economic immigrants to the province. In 2018, Manitoba’s Provincial Nominees accounted for 91.0% of all economic immigrants (9,895) while 9.0% arrived under other economic categories (975).
In the last decade, roughly 21% of Provincial Nominees settled outside of the Winnipeg municipality, compared to 13.3% from all other immigrant classes.
Manitoba continues to establish partnerships with employers to receive the largest share of Provincial Nominees across Canada over a ten-year period. In 2018, Manitoba received roughly 15.8% of all Provincial Nominees to Canada, fourth highest after Ontario, Saskatchewan, British Columbia, and Alberta.
Manitoba continues to work with the federal government, employers, and communities to attract and retain immigrants. Manitoba Provincial Nominees who landed between 2012 and 2016, and filed taxes in 2016, have a retention rate of 88.7% (IMDB 2016).
Sponsored Family
Eligible Canadian citizens and permanent residents living in Canada can sponsor their family members, spouses and dependents and grandparents to come to Canada. In 2018, Manitoba received 2,745 permanent residents or 18.0% of all landings through the Sponsored Family category. The top source countries accounting for 62% of this category include India, Philippines, China and the United States.
Refugees
Refugees from all over the world settle in communities throughout Manitoba. Various groups and service provider organizations throughout the province support newly arrived refugees as well as continue to support those who arrived within the past few years.
In 2018, Manitoba resettled 1,565 refugees and protected persons, just over 3.4% of all refugees and protected persons to Canada including close to 5.5% of Canada’s government-assisted refugees (445) and 5.0% of privately sponsored refugees (935). Of all resettled refugees in Manitoba, close to 27.8% are from Eritrea, while the remaining 72.2% are from Syria, Somalia, Iraq, Democratic Republic of Congo, and Ethiopia. Refugees and protected persons represent 10.3% of all new permanent residents to Manitoba in 2018.
Table 8: Resettled Refugees Admitted to Manitoba by Country of Citizenship, 2016 to 2018
| Country of Citizenship | Number | Percentage |
|---|---|---|
| Eritrea | 2,540 | 35.4% |
| Syria | 1,875 | 26.2% |
| Somalia, Democratic Republic of | 845 | 11.8% |
| Ethiopia | 505 | 7.0% |
| Congo, Democratic Republic of the | 410 | 5.7% |
| Iraq | 400 | 5.6% |
| Afghanistan | 130 | 1.8% |
| Sudan, Democratic Republic of | 75 | 1.0% |
| Myanmar (Burma) | 50 | 0.7% |
| Other | 340 | 4.7% |
| Total | 7,170 | 100.0% |
In 2018, the provincial Interdepartmental Asylum Seeker Planning Team helped to manage the intake and flow of approximately 620 asylum seekers, a combination of irregular migrants and inland claimants as well as secondary migrants from other jurisdictions. Refugee claims in Manitoba dropped 42.9% in 2018 from 1,085 in 2017.
4. Destination
Regional Destination (Economic Region)
Immigration continues to benefit regional communities. Between 2009 and 2018, approximately 117,585 immigrants settled in the Winnipeg Economic Region, while more than 28,060 immigrants have settled in other economic regions outside of Winnipeg. In 2018, 21% of newcomers chose to live outside of Winnipeg (3,200) and all economic regions of the province saw increases in immigration compared to 2017 with the exception of North, Interlake and North Central.
Table 9: Manitoba Permanent Residents by Intended Destination
| Economic Region | 2016 | 2017 | 2018 | ||||||
|---|---|---|---|---|---|---|---|---|---|
| Number | Percentage | Rank | Number | Percentage | Rank | Number | Percentage | Rank | |
| Winnipeg | 14,015 | 83.3% | 1 | 11,785 | 80.1% | 1 | 12,030 | 79.0% | 1 |
| Southwest | 1,080 | 6.4% | 2 | 1,160 | 7.9% | 2 | 1,285 | 8.4% | 2 |
| South Central | 720 | 4.3% | 3 | 560 | 3.8% | 3 | 705 | 4.6% | 3 |
| Southeast | 395 | 2.3% | 4 | 435 | 3.0% | 4 | 500 | 3.3% | 4 |
| North | 210 | 1.2% | 5 | 330 | 2.2% | 5 | 310 | 2.0% | 5 |
| Parklands | 170 | 1.0% | 6 | 145 | 1.0% | 7 | 155 | 1.0% | 6 |
| Interlake | 100 | 0.6% | 8 | 150 | 1.0% | 6 | 135 | 0.9% | 7 |
| North Central | 115 | 0.7% | 7 | 130 | 0.9% | 8 | 105 | 0.7% | 8 |
| Not found | 15 | 0.1% | 5 | 0.0% | — | — | |||
| Total | 16,825 | 100.0% | 14,705 | 100.0% | 15,230 | 100.0% | |||
Community Destination (Municipality)
Since 2009, approximately 121,590 immigrants settled in the City of Winnipeg compared to approximately 28,115 who chose more than 130 regional communities as their destination within Manitoba. During this period, top regional destinations included Brandon (7,535), Winkler (2,925), Neepawa (2,795), Steinbach (2,465), and Thompson (1,645).
In 2018, 3,205 new permanent residents chose regional communities outside of Winnipeg, a 9.4% increase from 2017 (2,930). The top immigrant source countries to regional communities in 2018 include Philippines (895), India (645), Nigeria (210), Germany (185), and Ukraine (160).
Table 10: Manitoba Permanent Residents by Intended Destination (Top Ten)
| Municipality | 2016 | 2017 | 2018 | ||||||
|---|---|---|---|---|---|---|---|---|---|
| Number | Percentage | Rank | Number | Percentage | Rank | Number | Percentage | Rank | |
| Winnipeg | 14,010 | 83.3% | 1 | 11,775 | 80.1% | 1 | 12,020 | 78.9% | 1 |
| Brandon | 635 | 3.8% | 2 | 645 | 4.4% | 2 | 705 | 4.6% | 2 |
| Neepawa | 255 | 1.5% | 4 | 375 | 2.6% | 3 | 430 | 2.8% | 3 |
| Morden | 300 | 1.8% | 3 | 210 | 1.4% | 6 | 250 | 1.6% | 4 |
| Thompson | 150 | 0.9% | 7 | 255 | 1.7% | 4 | 230 | 1.5% | 5 |
| Steinbach | 215 | 1.3% | 6 | 255 | 1.7% | 4 | 225 | 1.5% | 6 |
| Winkler | 255 | 1.5% | 4 | 180 | 1.2% | 7 | 210 | 1.4% | 7 |
| Altona | 50 | 0.3% | 9 | — | — | 80 | 0.5% | 8 | |
| Portage la Prairie | 105 | 0.6% | 8 | 100 | 0.7% | 8 | 80 | 0.5% | 8 |
| Russell | 50 | 0.3% | 9 | — | — | 50 | 0.3% | 10 | |
| Dauphin | 50 | 0.3% | 9 | 50 | 0.3% | 9 | |||
| Killarney | 50 | 0.3% | 9 | — | — | ||||
| The Pas | 50 | 0.3% | 9 | 50 | 0.3% | 9 | |||
| Total Top Ten | 16,175 | 96.1% | 13,845 | 94.2% | 14,280 | 93.8% | |||
| Other Municipalities | 650 | 3.9% | 860 | 5.8% | 950 | 6.2% | |||
| Total | 16,825 | 100.0% | 14,705 | 100.0% | 15,230 | 100.0% | |||
5. Source Country
In 2018, India, Philippines, Nigeria, China and Eritrea ranked among the top five source countries for immigrants to Manitoba, representing 61.7% of all immigrants.
Table 11: Manitoba Permanent Residents by Country of Citizenship (Top Ten)
| Country of Citizenship | 2016 | 2017 | 2018 | ||||||
|---|---|---|---|---|---|---|---|---|---|
| Number | Percentage | Rank | Number | Percentage | Rank | Number | Percentage | Rank | |
| India | 2,995 | 17.8% | 2 | 3,465 | 23.6% | 1 | 3,765 | 24.7% | 1 |
| Philippines | 3,605 | 21.4% | 1 | 3,110 | 21.1% | 2 | 2,370 | 15.6% | 2 |
| Nigeria | 525 | 3.1% | 7 | 625 | 4.3% | 5 | 1,475 | 9.7% | 3 |
| China, People’s Republic of | 1,025 | 6.1% | 5 | 1,165 | 7.9% | 3 | 1,300 | 8.5% | 4 |
| Eritrea | 1,420 | 8.4% | 3 | 810 | 5.5% | 4 | 480 | 3.2% | 5 |
| Ukraine | 460 | 2.7% | 8 | — | — | 330 | 2.2% | 6 | |
| Pakistan | 400 | 2.4% | 9 | 370 | 2.5% | 7 | 325 | 2.1% | 7 |
| Korea | — | — | — | — | 325 | 2.1% | 7 | ||
| Israel | 640 | 3.8% | 6 | 415 | 2.8% | 6 | 320 | 2.1% | 8 |
| Syria | 1,245 | 7.4% | 4 | 350 | 2.4% | 8 | 315 | 2.1% | 9 |
| Somalia, Democratic Republic of | 365 | 2.2% | 10 | 295 | 2.0% | 9 | 275 | 1.8% | 10 |
| Ethiopia | — | — | 275 | 1.9% | 10 | — | — | ||
| Total Top Ten | 12,680 | 75.4% | 10,880 | 74.0% | 11,280 | 74.1% | |||
| Other Countries | 16,825 | 100.0% | 14,705 | 100.0% | 15,230 | 100.0% | |||
| Total | 16,825 | 100.0% | 14,705 | 100.0% | 15,230 | 100.0% | |||
In 2018, 57.1% of Manitoba’s new permanent residents arrived from Asia and Pacific regions, followed by Africa and the Middle East (28.2%), Europe (7.8%), South and Central America (5.0%) and the United States (1.8%).
Table 12: Manitoba Permanent Residents by World Region, 2016 to 2018
| World Region | 2016 | 2017 | 2018 |
|---|---|---|---|
| Asia & Pacific | 8,825 | 8,855 | 8,700 |
| Africa & Middle East | 5,520 | 3,845 | 4,300 |
| Canada | — | — | — |
| Europe | 1,675 | 1,080 | 1,185 |
| Americas | 605 | 670 | 760 |
| United States of America | 195 | 245 | 275 |
| Stateless & Not Stated | 5 | 15 | 5 |
| Total | 16,825 | 14,705 | 15,230 |
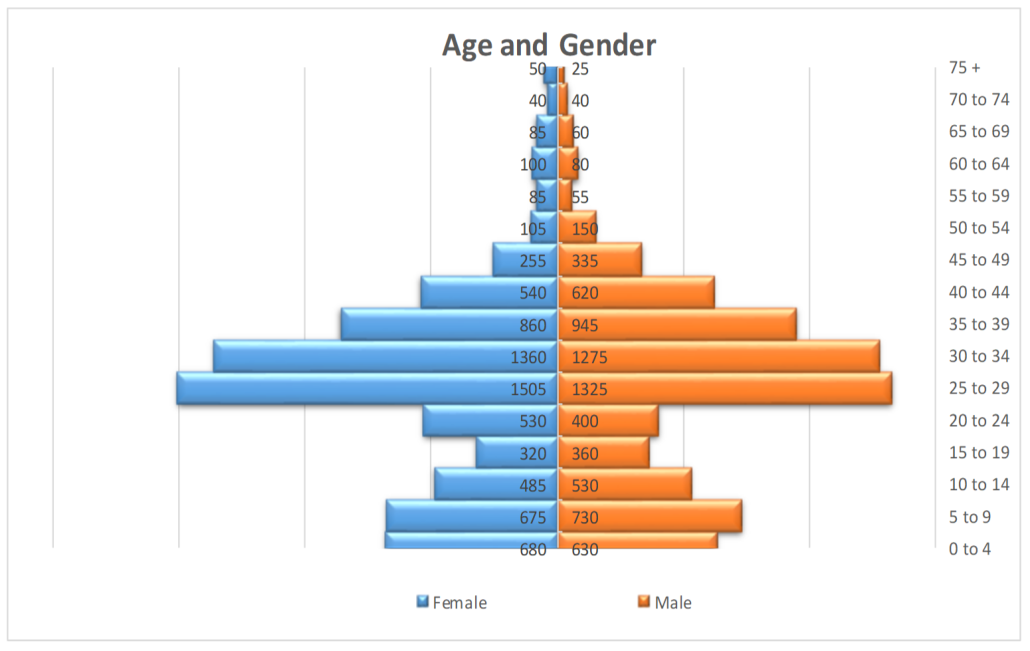
6. Demographics
Age-Gender Structure
Newcomers are important contributors to Manitoba’s population growth and to the rejuvenation of the labour force. In 2018, the immigrant median age was 28.5 years while the median age of Manitobans was 38.3 years (Census 2016). Male and female numbers were roughly equal.
7. Official Languages
Table 13: Manitoba Permanent Residents by Mother Tongue (Top Ten)
| Mother Tongue | 2016 | 2017 | 2018 | ||||||
|---|---|---|---|---|---|---|---|---|---|
| Number | Percentage | Rank | Number | Percentage | Rank | Number | Percentage | Rank | |
| Punjabi | 2,055 | 12.2% | 2 | 2,360 | 16.0% | 2 | 2,640 | 17.3% | 1 |
| Tagalog | 3,060 | 18.2% | 1 | 2,675 | 18.2% | 1 | 1,960 | 12.9% | 2 |
| Chinese | 1,085 | 6.4% | 5 | 1,225 | 8.3% | 3 | 1,425 | 9.4% | 3 |
| English | 780 | 4.6% | 7 | 720 | 4.9% | 4 | 890 | 5.8% | 4 |
| Yoruba | — | — | 405 | 2.8% | 9 | 845 | 5.5% | 5 | |
| Arabic | 1,490 | 8.9% | 3 | 625 | 4.3% | 6 | 665 | 4.4% | 6 |
| Gujarati | 515 | 3.1% | 8 | 610 | 4.1% | 7 | 570 | 3.7% | 7 |
| Russian | 1,060 | 6.3% | 6 | 595 | 4.0% | 8 | 515 | 3.4% | 8 |
| Tigrinya | 1,100 | 6.5% | 4 | 630 | 4.3% | 5 | 375 | 2.5% | 9 |
| German | — | — | — | — | 330 | 2.2% | 10 | ||
| Hindi | — | — | — | — | 330 | 2.2% | 10 | ||
| Urdu | 350 | 2.1% | 10 | 330 | 2.2% | 10 | |||
| Somali | 380 | 2.3% | 9 | — | — | ||||
| Total Top Ten | 11,875 | 70.6% | 10,175 | 69.2% | 10,545 | 69.2% | |||
| Other Languages | 4,950 | 29.4% | 4,530 | 30.8% | 4,685 | 30.8% | |||
| Total | 16,825 | 100.0% | 14,705 | 100.0% | 15,230 | 100.0% | |||
Official Language Spoken
In 2018, the percentage of Manitoba’s immigrants who identified English as an official language spoken continued increasing to 77.4% from 64% in 2010.
In 2018, Manitoba welcomed 395 immigrants who identified French as their official language spoken, representing 2.6% of all immigrants to Manitoba. From 2009 to 2018, over 4,330 immigrants have arrived in Manitoba with the ability to speak French.
The top 10 source countries for all immigrants who identified French, as well as both French and English, as their official language spoken were Democratic Republic of Congo (DRC), France, Morocco, Mauritius, Philippines, Algeria Cameroon, Senegal, Burundi, and India.
Manitoba supports the Manitoba francophone community’s goal of increasing francophone immigration. In 2018, 3% of all MPNP nominations were francophone and approximately 77% of all French-speaking immigrants came through the MPNP.
Table 14: Manitoba Permanent Residents by Official Language Spoken
| Official Language | 2016 | 2017 | 2018 |
|---|---|---|---|
| English | 11,530 | 10,820 | 11,795 |
| French | 175 | 150 | 110 |
| Both French and English | 340 | 305 | 285 |
| Neither | 4,255 | 3,055 | 2,575 |
| Not stated | 530 | 375 | 465 |
| Total | 16,825 | 14,705 | 15,230 |
8. Education, Occupation, and Skill Level
To ensure that immigrants can contribute their skills and experience to Manitoba’s economy, the Province is renewing the MPNP to strengthen partnerships with industry and post-secondary institutions. In addition, the Province continues to invest in successful employment programs like Manitoba Start which also provides guidance to professionals needing to have their international qualifications recognized. In 2018, more than 54.0% of permanent residents aged 25 and older have a bachelor’s degree or higher.
Table 15: Manitoba Permanent Residents by Level of Education (Aged 25 Years and Over)
| Level of Education | 2016 | 2017 | 2018 | |||
|---|---|---|---|---|---|---|
| Secondary or Less | 2,220 | 21.5% | 1,790 | 19.2% | 1,635 | 16.5% |
| Formal Trade Cert. or Apprenticeship | 640 | 6.2% | 620 | 6.6% | 660 | 6.7% |
| Non-University Certificate or Diploma | 670 | 6.5% | 675 | 7.2% | 700 | 7.1% |
| Some University – No Degree | 550 | 5.3% | 515 | 5.5% | 555 | 5.6% |
| Bachelor’s Degree | 3,945 | 38.2% | 3,460 | 37.0% | 3,590 | 36.3% |
| Some Post-Grad. Education – No Degree | 220 | 2.1% | 210 | 2.2% | 205 | 2.1% |
| Master’s Degree | 1,310 | 12.7% | 1,255 | 13.4% | 1,450 | 14.7% |
| Doctorate | 85 | 0.8% | 95 | 1.0% | 95 | 1.0% |
| Not Stated | 680 | 6.6% | 715 | 7.7% | 995 | 10.1% |
| Total | 10,330 | 100% | 9,340 | 100% | 9,890 | 100% |
Occupation
The Manitoba Provincial Nominee Program selects people whose participation enhances Manitoba’s economic development with specialized skills needed in the changing labour market. Cooks, food counter attendants, transport truck drivers, registered nurses and industrial butchers and meat cutters were among the top occupations of economic immigrants (principal applicants only) to Manitoba in 2018.
Table 16: Manitoba Economic Permanent Residents by Skill Level
| Skill Level | Number | Percentage |
|---|---|---|
| 0 – Managerial | 690 | 14.5% |
| A – Professionals | 1,100 | 23.2% |
| B – Skilled and Technical | 1,485 | 31.3% |
| C – Intermediate and Clerical | 1,155 | 24.3% |
| D – Elemental and Labourers | 285 | 6.0% |
| Intending to work* | 35 | 0.7% |
| Not intending to work* | — | — |
| Total | 4,750 | 100.0% |
*Intending to work includes New Workers (15 years of age or older); Not intending to work includes Other Non-Workers (15 years of age or older); and Students (15 years of age or older).
Rank is based on the highest number of landing by occupation for economic principal applicants only in 2018.
Skill Type Category
Based on the National Occupation Classification System, in 2018, 68.9% of principal applicants under the economic category were considered highly skilled (NOC 0, A and B) and had previous occupations in:
- Sales and service
- Business, finance and administration
- Natural and applied sciences and related occupations
- Management Occupations
- Trades, Transport and Equipment Operators and Related Occupations
- Occupations in education, law and social, community and government services
Table 17: Manitoba Economic Permanent Residents by Skill Type
| Principal Applicants Only | 2016 | 2017 | 2018 | |||
|---|---|---|---|---|---|---|
| Skill Type Category | Number | Percentage | Number | Percentage | Number | Percentage |
| 0 – Management Occupations | 545 | 12.3% | 425 | 10.0% | 460 | 9.7% |
| 1 – Business, Finance and Administration Occupations | 755 | 17.1% | 760 | 18.0% | 765 | 16.1% |
| 2 – Natural and Applied Sciences and Related Occupations | 630 | 14.2% | 605 | 14.3% | 650 | 13.7% |
| 3 – Health Occupations | 400 | 9.0% | 330 | 7.8% | 310 | 6.5% |
| 4 – Occupations in Education, Law and Social, Community and Government | 320 | 7.2% | 325 | 7.7% | 430 | 9.1% |
| 5 – Occupations in Art, Culture, Recreation and Sport | 45 | 1.0% | 50 | 1.2% | 50 | 1.1% |
| 6 – Sales and Service Occupations | 770 | 17.4% | 800 | 18.9% | 1,050 | 22.1% |
| 7 – Trades, Transport and Equipment Operators and Related Occupations | 445 | 10.1% | 445 | 10.5% | 435 | 9.2% |
| 8 – Natural Resources, Agriculture and Related Production Occupations | 80 | 1.8% | 70 | 1.7% | 75 | 1.6% |
| 9 – Occupations in Manufacturing and Utilities | 210 | 4.7% | 200 | 4.7% | 255 | 5.4% |
| Other* | 220 | 5.0% | 215 | 5.1% | 265 | 5.6% |
| Not stated | — | — | 0 | — | — | — |
| Total | 4,425 | 100.0% | 4,230 | 100.0% | 4,750 | 100.0% |
*Other category includes principal applicants not intending to work and other occupations not covered by an NOC code.
9. Temporary Workers and International Students
In Manitoba, temporary residents who have worked for more than six months, or have graduated from a post-secondary program in the province, have the opportunity to apply to the MPNP and become permanent residents. In 2018, Manitoba received 8,035 temporary workers through the federal International Mobility Program and 1,170 through the Temporary Foreign Worker Program (with a Labour Market Impact Assessment).
- The total unique count may not equal to the sum of permit holders in each program as an individual may hold more than one type of permit over a given period.
- The table on Temporary Residents (TR) has been revised to reflect the June 20, 2014 overhaul of the Temporary Foreign Worker Program (TFWP). The reporting methodology has also been revised to count TRs, which includes Foreign Workers and International Students, based on the type of permit held by a TR (effective from the date that the permit was signed, or a valid permit at the end of a given year). As a result of the changes above, the reports for each permit holder type has been separated in order to enhance clarity.
Table 18: Manitoba Work Permit Holders by Program and Year in which Permit(s) Became Effective*
| 2009 | 2010 | 2011 | 2012 | 2013 | 2014 | 2015 | 2016 | 2017 | 2018 | |
|---|---|---|---|---|---|---|---|---|---|---|
| Temporary Foreign Worker Program Work Permit Holders | 1,710 | 1,320 | 1,345 | 1,860 | 1,795 | 1,380 | 885 | 870 | 765 | 1,170 |
| International Mobility Program Work Permit Holders | 3,415 | 3,710 | 3,875 | 4,025 | 4,720 | 5,035 | 5,055 | 6,690 | 7,185 | 8,035 |
Table 19: Manitoba Temporary Foreign Worker Program Work Permit Holders by Intended Destination and Year in which Permit(s) Became Effective*
| Census Metropolitan Area | 2009 | 2010 | 2011 | 2012 | 2013 | 2014 | 2015 | 2016 | 2017 | 2018 |
|---|---|---|---|---|---|---|---|---|---|---|
| Brandon | 255 | 100 | 190 | 315 | 245 | 220 | 180 | 140 | 135 | 130 |
| Winnipeg | 960 | 825 | 730 | 820 | 855 | 520 | 255 | 270 | 250 | 280 |
| Other | 500 | 400 | 430 | 730 | 700 | 645 | 455 | 460 | 380 | 760 |
| Total Unique TFW Work Permit Holders | 1,710 | 1,320 | 1,345 | 1,860 | 1,795 | 1,380 | 885 | 870 | 765 | 1,170 |
Table 20: Manitoba International Mobility Program Work Permit Holders by Intended Destination and Year in which Permit(s) Became Effective*
| Census Metropolitan Area | 2009 | 2010 | 2011 | 2012 | 2013 | 2014 | 2015 | 2016 | 2017 | 2018 |
|---|---|---|---|---|---|---|---|---|---|---|
| Brandon | 370 | 370 | 230 | 170 | 195 | 265 | 195 | 185 | 245 | 245 |
| Winnipeg | 2,370 | 2,560 | 2,755 | 3,000 | 3,365 | 3,255 | 3,540 | 5,095 | 5,430 | 6,240 |
| Other | 685 | 790 | 895 | 860 | 1,205 | 1,570 | 1,345 | 1,440 | 1,545 | 1,575 |
| Total Unique IMP Work Permit Holders | 3,415 | 3,710 | 3,875 | 4,025 | 4,720 | 5,035 | 5,055 | 6,690 | 7,185 | 8,035 |
International Students
In 2018, the number of foreign student’s entries to Manitoba was 11,670. Most international students (95.8%) enrolled in educational institutions in Winnipeg. The top source countries to Manitoba were India (24.4%), China (22.9%), Nigeria (8.0%) and Bangladesh (6.7%).
Table 21: Manitoba International Student Study Permit Holders by Intended Destination and Year in which Permit(s) Became Effective*
| Census Metropolitan Area | 2009 | 2010 | 2011 | 2012 | 2013 | 2014 | 2015 | 2016 | 2017 | 2018 |
|---|---|---|---|---|---|---|---|---|---|---|
| Brandon | 135 | 130 | 145 | 150 | 175 | 160 | 240 | 290 | 410 | 495 |
| Winnipeg | 3,115 | 3,095 | 3,980 | 4,450 | 5,235 | 5,650 | 6,365 | 7,955 | 9,670 | 11,185 |
| Other | 340 | 315 | 395 | 375 | 320 | 345 | 325 | 335 | 395 | 350 |
| Total Unique Study Permit Holders | 3,245 | 3,225 | 4,125 | 4,605 | 5,405 | 5,810 | 6,605 | 8,245 | 10,075 | 11,670 |
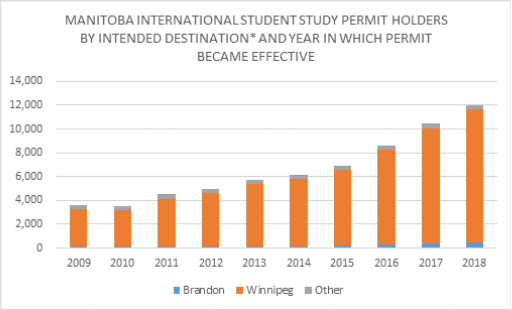
Table 22: Manitoba International Student Study Work Permit Holders by Country of Citizenship and Year in which Permit Became Effective
| Country of Citizenship | 2016 | 2017 | 2018 | ||||||
|---|---|---|---|---|---|---|---|---|---|
| Number | Percentage | Rank | Number | Percentage | Rank | Number | Percentage | Rank | |
| India | 1,140 | 13.3% | 2 | 1,990 | 19.0% | 2 | 2,935 | 24.4% | 1 |
| China, People’s Republic of | 2,390 | 27.9% | 1 | 2,595 | 24.8% | 1 | 2,750 | 22.9% | 2 |
| Nigeria | 825 | 9.6% | 3 | 900 | 8.6% | 3 | 965 | 8.0% | 3 |
| Bangladesh | 250 | 2.9% | 8 | 480 | 4.6% | 4 | 800 | 6.7% | 4 |
| Vietnam, Socialist Republic of | 285 | 3.3% | 7 | 900 | 8.6% | 5 | 500 | 4.2% | 5 |
| Brazil | 385 | 4.5% | 4 | 480 | 4.6% | 6 | 405 | 3.4% | 6 |
| Korea, Republic of | 355 | 4.1% | 5 | 425 | 4.1% | 7 | 340 | 2.8% | 7 |
| Pakistan | 340 | 4.0% | 6 | 260 | 2.5% | 8 | 235 | 2.0% | 8 |
| United States of America | — | — | 195 | 1.9% | 9 | 190 | 1.6% | 9 | |
| Kenya | 155 | 1.8% | 10 | 165 | 1.4% | 10 | |||
| Iran | — | — | 155 | 1.5% | 10 | ||||
| Japan | 165 | 1.9% | 9 | ||||||
| Total Top Ten | 6,290 | 73.4% | 8,380 | 80.1% | 9,285 | 77.3% | |||
| Other Countries of Citizenship | 2,285 | 26.6% | 2,085 | 19.9% | 2,730 | 22.7% | |||
| Total | 8,575 | 100.0% | 10,465 | 100.0% | 12,015 | 100.0% | |||
Table 23: Manitoba International Student Study Work Permit Holders by Country of Citizenship at Year End*
| Country of Citizenship | 31-Dec-2016 | 31-Dec-2017 | 31-Dec-2018 | ||||||
|---|---|---|---|---|---|---|---|---|---|
| Number | Percentage | Rank | Number | Percentage | Rank | Number | Percentage | Rank | |
| China, People’s Republic of | 4,330 | 31.4% | 1 | 4,410 | 26.8% | 1 | 4,245 | 22.7% | 1 |
| India | 1,510 | 11.0% | 2 | 2,540 | 15.4% | 2 | 4,090 | 21.9% | 2 |
| Nigeria | 1,500 | 10.9% | 3 | 1,695 | 10.3% | 3 | 1,815 | 9.7% | 3 |
| Bangladesh | 365 | 2.6% | 8 | 640 | 3.9% | 5 | 1,045 | 5.6% | 4 |
| Vietnam, Socialist Republic of | 400 | 2.9% | 7 | 710 | 4.3% | 4 | 895 | 4.8% | 5 |
| Brazil | 525 | 3.8% | 4 | 635 | 3.9% | 6 | 605 | 3.2% | 6 |
| Korea, Republic of | 490 | 3.6% | 6 | 580 | 3.5% | 7 | 525 | 2.8% | 7 |
| Pakistan | 525 | 3.8% | 4 | 505 | 3.1% | 8 | 455 | 2.4% | 8 |
| United States of America | 295 | 2.1% | 9 | 365 | 2.2% | 9 | 375 | 2.0% | 9 |
| Kenya | 225 | 1.6% | 10 | — | — | 305 | 1.6% | 10 | |
| Iran | — | — | 270 | 1.6% | 10 | ||||
| Total Top Ten | 10,165 | 73.8% | 12,350 | 75.1% | 14,355 | 76.8% | |||
| Other Countries of Citizenship | 3,615 | 26.2% | 4,095 | 24.9% | 4,325 | 23.2% | |||
| Total | 13,780 | 100.0% | 16,445 | 100.0% | 18,680 | 100.0% | |||